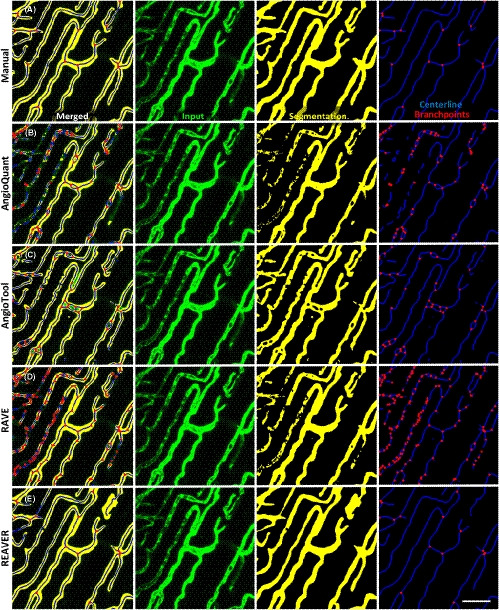
FIGURE 2.

Manual segmentation and analysis can be used as ground‐truth in comparing quantification pipelines. Representative image processed with A, manual analysis, B, AngioQuant, C, AngioTool, D, RAVE, and E, REAVER with input (green), segmentation (yellow), centerline (blue), and branchpoints (red) of vascular network (scale bar 50 um)
