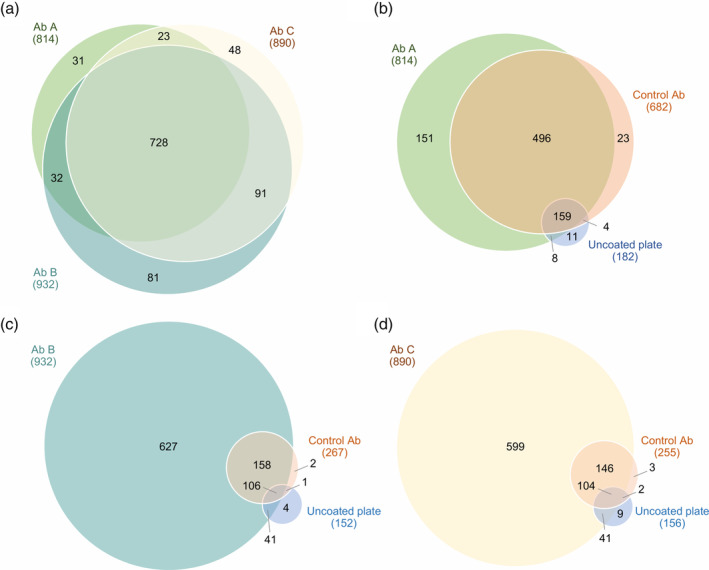
Figure 2.

Comparison of proteins recognized by the three HCP antibodies. (a) Comparison of E. coli HCPs recognized by Ab A, B, or C. (b‐d) Comparison of E. coli HCPs recognized by the HCP antibody, control antibody, or bound to uncoated plates. The negative control antibodies are species‐specific isotype controls (rabbit IgG [Ab A] or goat IgG [Ab B and C]). Data shown are one representative of three independent experiments (n = 1)
