
Figure 5.
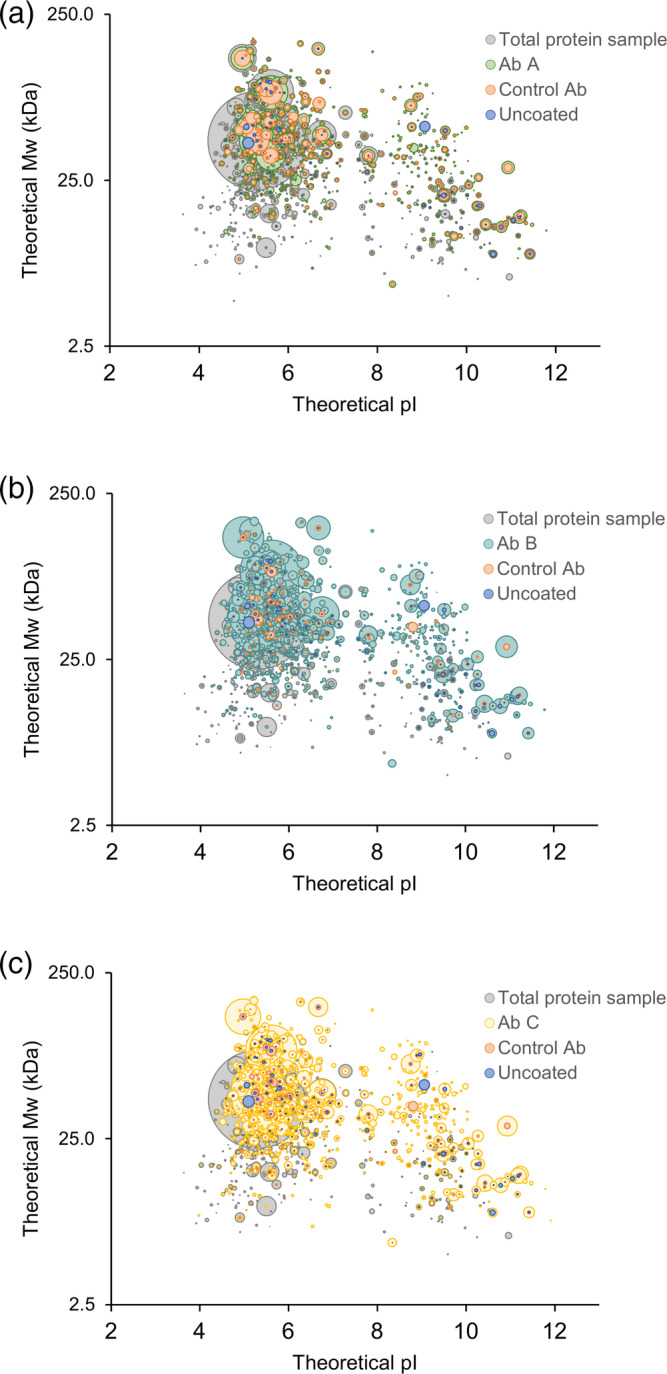
HCP antibody coverage across the theoretical molecular weight and isoelectric point (pI) range of the HCPs identified in the early process sample. 3D‐plots comparing HCPs identified in total protein sample to HCPs recognized by the three different HCP antibodies (Ab A, Ab B, and Ab C), species‐specific control antibodies, or bound to uncoated plates. Each spot represents a unique HCP and the spot size is scaled relative to the protein quantifications. Data shown are one representative of three independent experiments (n = 1)