Figure 6.

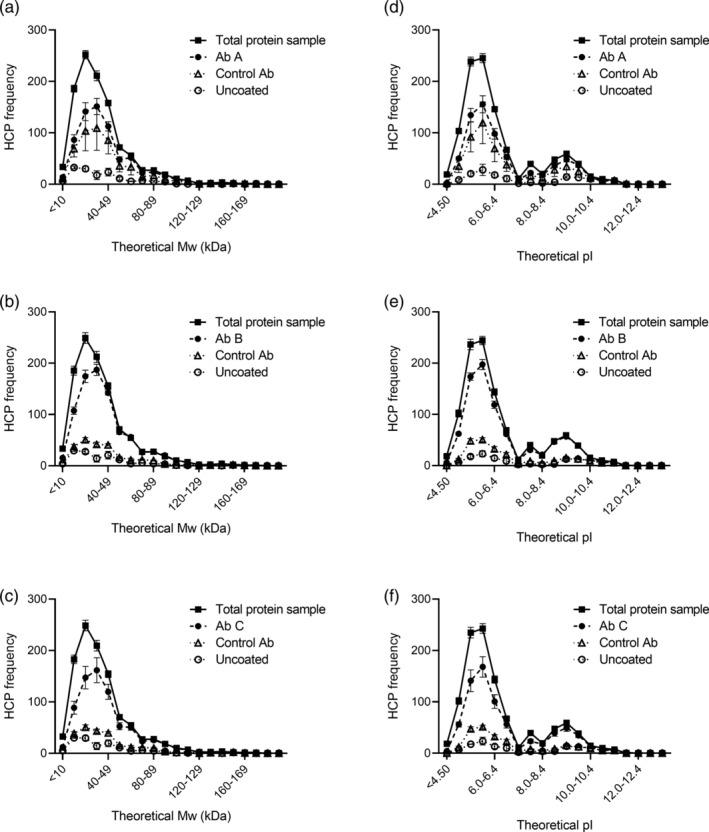
Frequency of HCPs identified in the different samples across the range of theoretical MW (a–c) and pI (d–f). Data are presented as mean ± SEM (n = 3. For the rabbit control antibody, n = 2)

Frequency of HCPs identified in the different samples across the range of theoretical MW (a–c) and pI (d–f). Data are presented as mean ± SEM (n = 3. For the rabbit control antibody, n = 2)