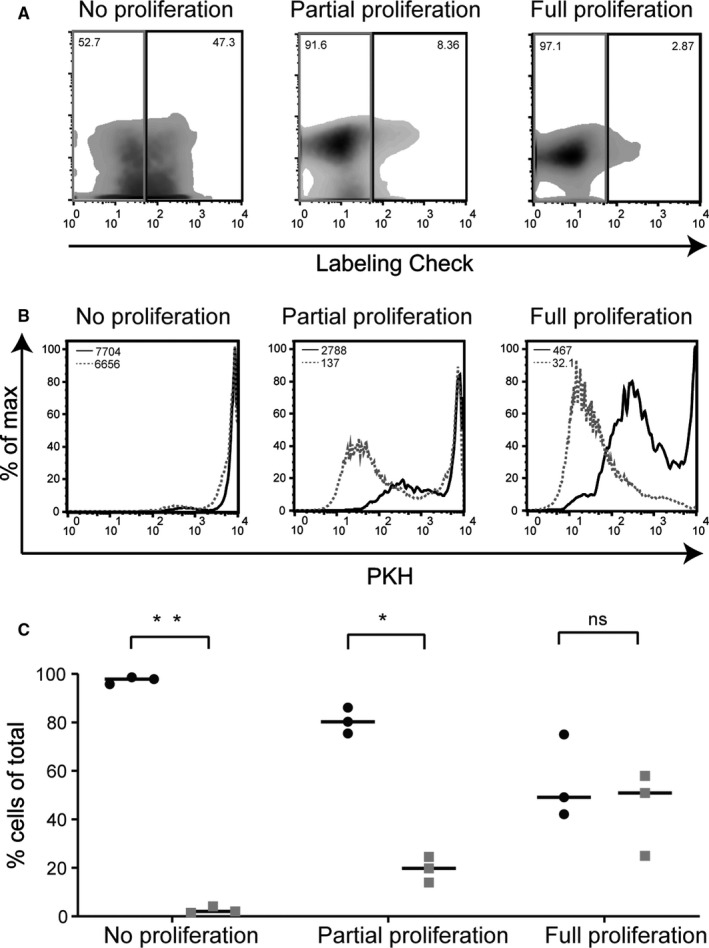
FIGURE 2.

Non‐divided, positively selected memory T cells retain magnetic nanoparticles on their cell surface. A, Representative (n = 3) density plots of viable cells show the Labeling Check reagent staining (positive for staining indicated by the black boxes and negative by the grey boxes) after 2 wk of in vitro culture under different stimulation conditions (from left to right: no/minimal proliferation (cytokines only); proliferation of a portion of T cells (allo‐reactive T cell response), and full, a‐specific proliferation of almost all T cells (PHA stimulation)). The gating of lymphocytes was based on forward and sideward scatter after which the CD3+ cells were selected and plotted for Labeling Check staining. The untouched isolated memory T cells were used to set the gates for the Labeling Check. B, From a representative (of n = 3) experiment, the Labeling Check reagent positive cells (black curves) and the Labeling Check reagent negative cells (grey dashed curves) were plotted as histograms for their PKH staining and compared by generating overlays of the two populations. C, After 2 wk of in vitro culture, the cell populations were again applied onto a MACS separator column. Composition quantification was done of the column‐retained fractions of the different stimulated cell populations by calculating the frequencies of dividing cells (grey squares, PKHdim) and non‐dividing cells (black circles, PKHbright). The column‐retained fractions were analyzed by gating on the lymphocytes using the forward and sideward scatter followed by selection of CD3+ cells to be plotted for PKH staining. The experiment was repeated three times using three different donors. The statistical analysis was performed with t test in Prism 8 (P‐value: *<.0005 and **<.000001)
