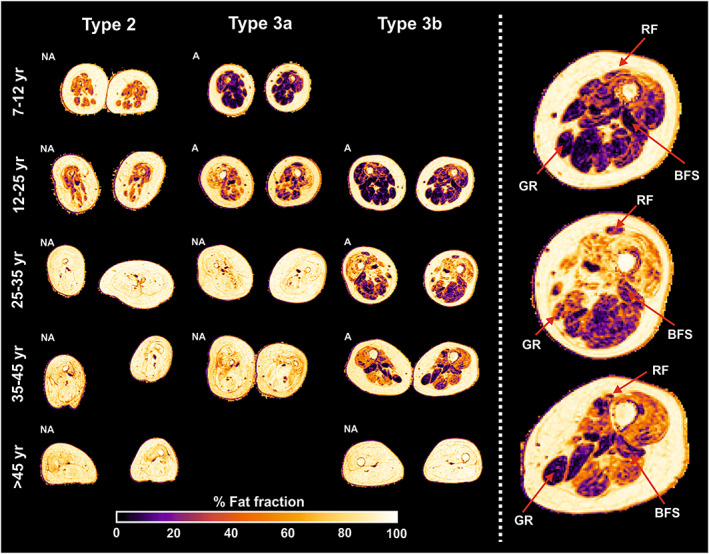
FIGURE 3.

Overview of fat infiltration stratified for SMA type and age. Images of the thigh in the transversal plane of the middle section of the image stack. The images are categorized into age category for distinct SMA types. The heat bar beneath indicates a scale from 0% to 100%. The right column presents a magnification of the left leg of type 3b patients. The red arrows point at the annotated muscles, which seem relatively spared. A, ambulant; BFS, biceps femoris, short head; GR, gracilis; NA, nonambulant; RF, rectus femoris
