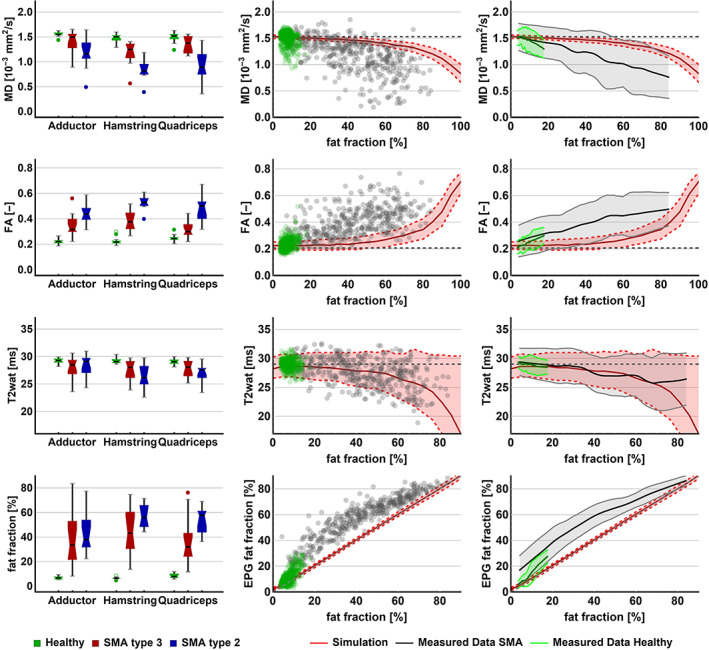
FIGURE 4.

qMRI per muscle group and relations between qMRI parameters. The left panel shows boxplots for the qMRI parameters for the distinct muscle groups for healthy controls, SMA type 2 and SMA type 3. In the middle and right panels, each of the qMRI parameters is plotted against fat fraction. In the middle column, each data point represents a measurement of individual muscles of all subjects with SMA (gray) and control subjects (green). In the right column, the data points are reduced to an average using local regression and 95% CI (shaded area). The red line represents the association based on simulations of increasing fat fraction, theoretically ranging to 100. The gray and green lines depict the data of this study. CI, confidence interval; FA, fractional anisotropy; MD, mean diffusivity
