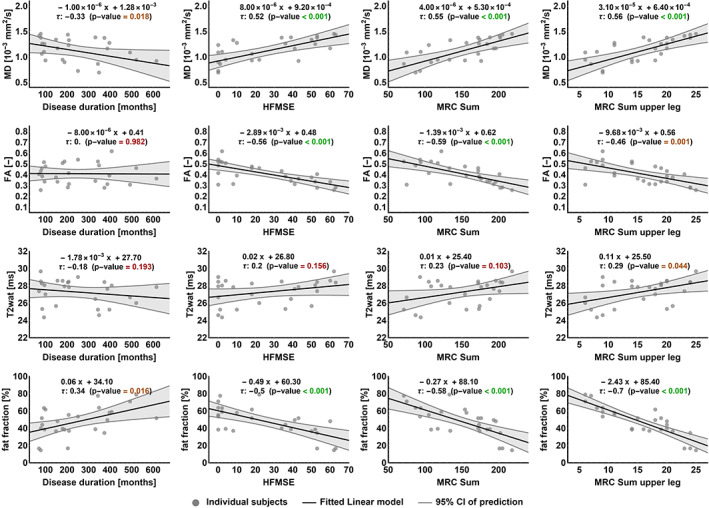
FIGURE 5.

qMRI and relation with clinical measures. Each of the qMRI parameters (rows) is plotted against the following clinical outcome measures (columns); disease duration (in months), HFMSE score, MRC sum score and MRC sum score of the upper leg. Data points represent the average value of all muscles per patient per qMRI parameter plotted against patient's clinical score. The correlation formula, Kendall's tau correlation coefficient and the P‐value (significance level set at <0.05) are shown per correlation plot. HFMSE, Hammersmith Motor Function Scale Expanded, MRC, Medical Research Council
