
FIGURE 3.
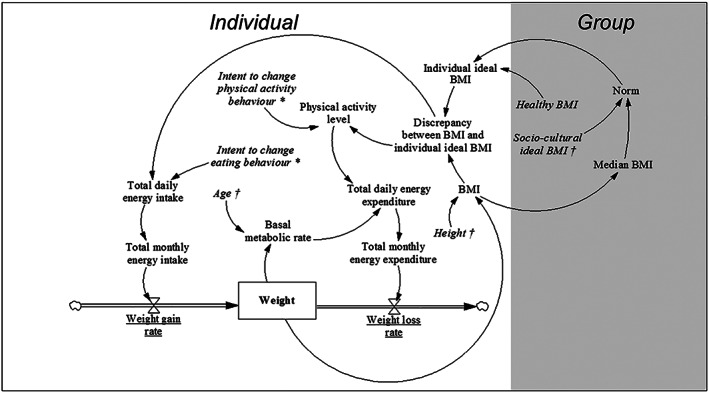
System dynamics model (SDM) mirroring the expert‐informed causal loop diagram (CLD) of the system of social norms regarding body weight perception and obesity prevalence. Variables (see Section 2.5) are connected by arrows indicating causal links. The stock is shown as a box (variable name displayed in bold, i.e. ‘Weight'), whereas flows are displayed as thick arrows (regulated by valves, variable names are underlined). Auxiliaries and constants are indicated in regular font and italics, respectively. Optimized parameters and constants based on initial values from the cohort data are marked with * and †, respectively