Figure 1.

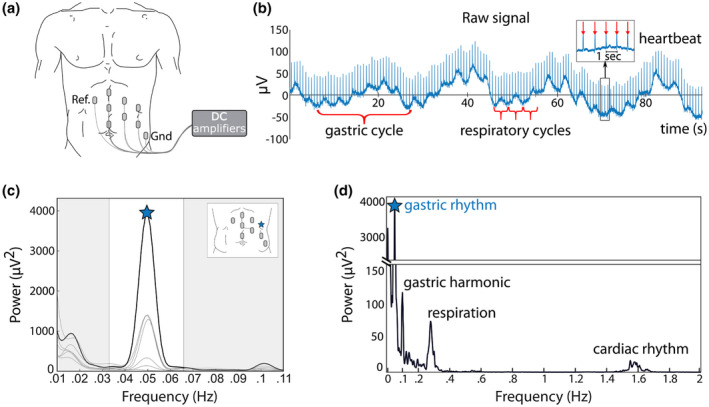
(a) Recording setup. Cutaneous electrodes are placed on the left abdomen of the participant in a grid‐like arrangement and connected to DC amplifiers. Ref. and Gnd correspond to Reference and Ground, respectively. (b) Example of raw data in one participant, where the gastric rhythm is visible as cycles of ~20 s length. Respiratory cycles are much faster (typically 3 to 5 s length). Heartbeats appear as transients every ~0.8 s (inset). EGG amplitude in this participant is close the median value observed in 100 participants. (c) Power spectrum at each of the seven recording electrodes. Peak frequency is indicated by a star on the channel with the largest power (black line). The white area corresponds to the normal frequency range of the EGG, also known as normogastria (2 to 4 cpm or 0.033 to 0.066 Hz). Inset: Electrode layout with the location of the electrode displaying the largest spectral power marked with a blue star. (d) Spectral density over a wider frequency range at the selected channel, revealing the spectral signatures of the respiratory (~0.3 Hz) and cardiac rhythms (~1.5 Hz)
