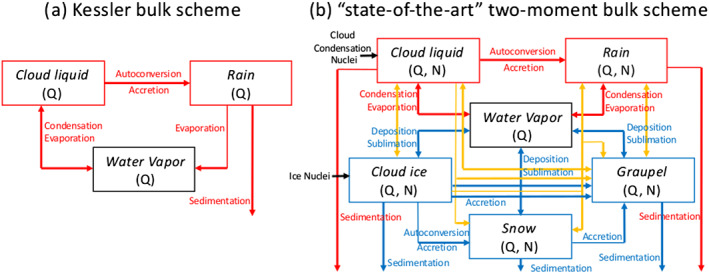
Figure 4.

Schematic diagrams of (a) the original Kessler bulk liquid microphysics scheme, (b) a typical state‐of‐the‐art two‐moment bulk microphysics scheme. Boxes represent different hydrometeor categories (liquid and ice) and water vapor. Q and N are the mass and number mixing ratios of a category. Arrows represent microphysical processes that convert Q and/or N between categories, as well as sedimentation (fallout from gravity). Red, yellow, and blue lines represent liquid, mixed‐phase, and ice‐phase processes. Adapted from Randall et al. (2019) (©American Meteorological Society, used with permission).
