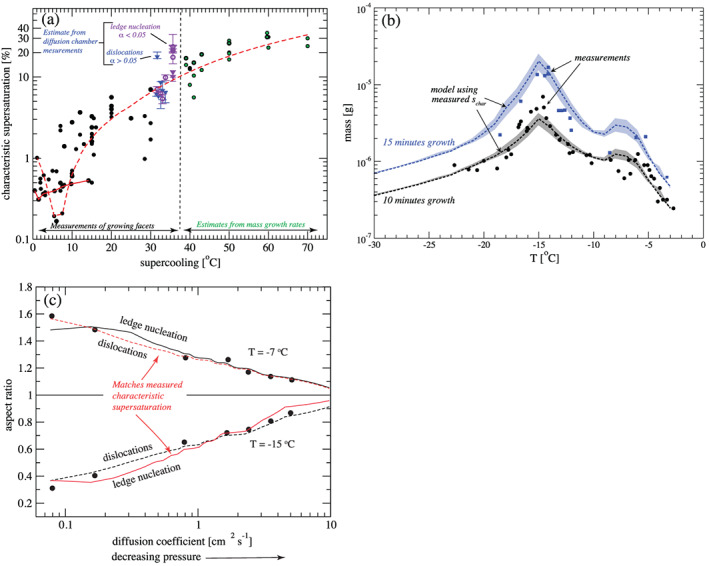
Figure 12.

(a) Characteristic ice supersaturation S char (y‐axis) as a function of temperature (x‐axis), obtained from laboratory measurements of faceted ice particle growth (black points) and approximated from mass growth measurements (green points). Values of S char for two different ice growth mechanisms (dislocations, blue, and ledge nucleation, purple) are derived from diffusion chamber measurements (Pokrifka, 2018). Fits to the S char data for the basal and prism facets are shown by the red dashed and solid lines, respectively (see Harrington et al., 2019 for details). (b) Comparison of modeled and measured single ice particle masses (y‐axis) after 10 min (black) and 15 min (blue) of diffusional growth at various temperatures (x‐axis). The model uses the fit values of S char in (a) and assumes ledge nucleation growth. (c) Measured (dots) and modeled (lines) ice particle aspect ratio variation with pressure. Although it is possible to model the data with either growth mechanism, only dislocation growth at −7°C and ledge nucleation growth at −15°C also match independently measured S char (see Harrington et al., 2019 for details). Figure adapted from Harrington et al. (2019) (©American Meteorological Society, used with permission).
