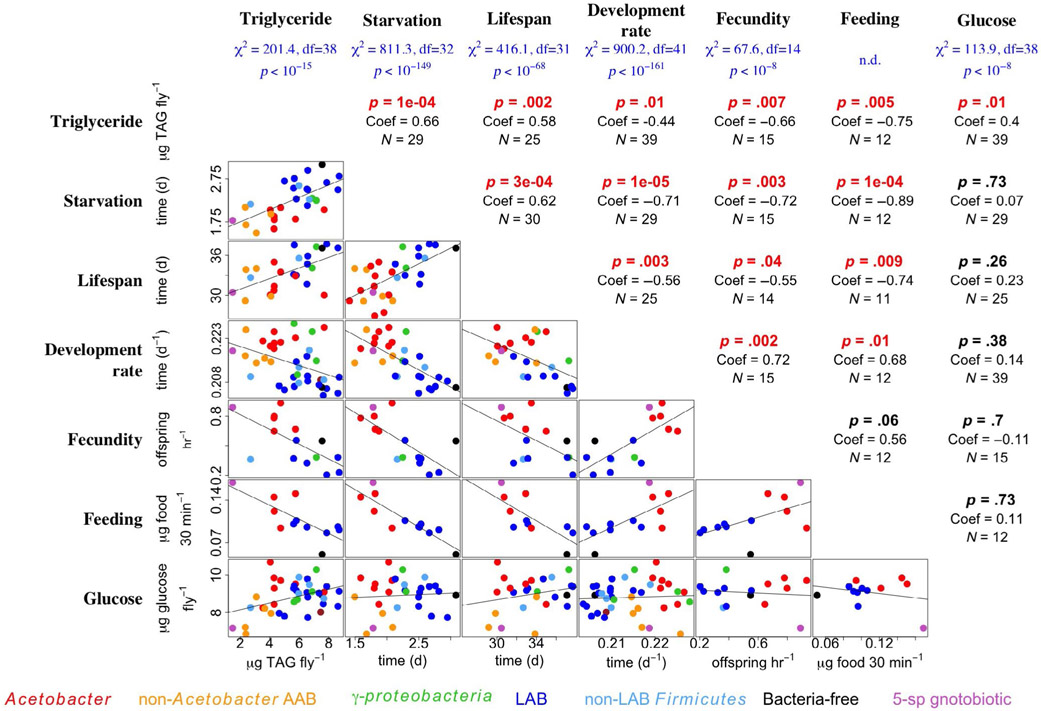
FIGURE 1.
Microbial variation influences life history patterns in a laboratory-reared isogenic fly line. Six life history traits were measured in Drosophila melanogaster that were mono-associated with different bacterial species and reared on a YG diet: whole-body triacylglyceride content (Triglyceride), survival under starvation conditions (Starvation), lifespan, the rate of development to pupariation (Development rate), number of pupariating offspring produced in the first 2–4 days after eclosion (Fecundity) and feeding rate (Feeding). Fly whole-body glucose content (Glucose), a trait that is not correlated with most other life history traits, was also measured. Significant influence of microbial treatment on the trait is shown at the top of the figure in blue under each trait. For triglyceride, fecundity and glucose, the chi-square statistic is from a Kruskal–Wallis test; for the other traits, it is from a Cox proportional hazards model. In the table portion, mean trait values conferred by different bacteria are plotted in the bottom half whereas the top half shows the results of correlation tests between traits in flies reared individually with the same microbe: p-values (p), correlation coefficients (Coef) and number of different mono-associations (N). p-values that were significant are shown in red. The data for triglyceride content, SR, development rate and feeding rate were published previously (Chaston et al., 2014; Judd et al., 2014; Newell et al., 2014)

