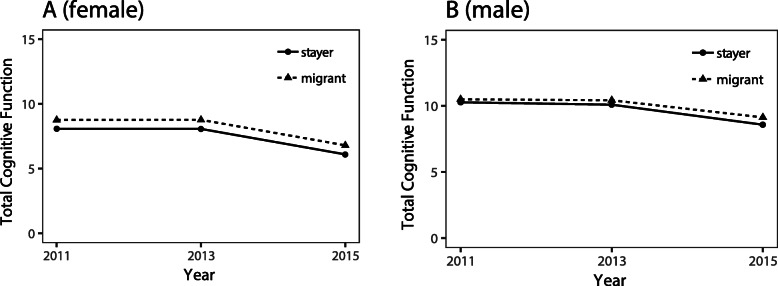
Fig. 1.
The sex-specific differences in total cognitive function trajectories function by migrant status. a Relationship between time (horizontal axis) and total cognitive function (range:0–21; vertical axis) of female according to migrant status. The dotted line and solid line represent migrant and stayer respectively, the dots represent the mean total cognitive function of each fellow-up point. b Association between time and total cognitive function of male according to migrant status. Over all the total cognitive function of male was higher than that of female. The cognitive performance of migrants was better than stayers, which was more pronounced in female

