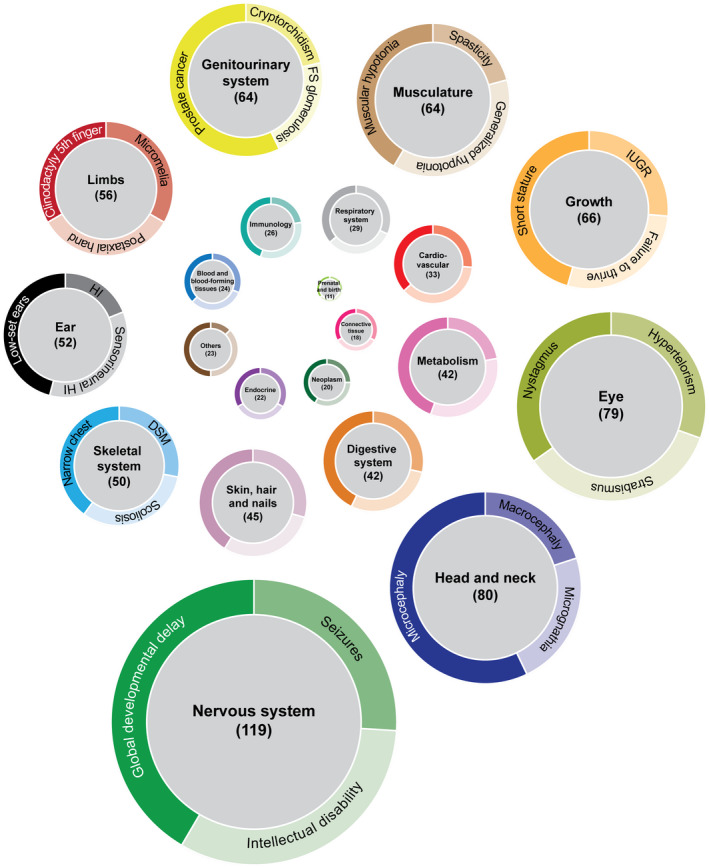
Figure 2.

Pathogenic variants in MIGs predominately affect the nervous system. Doughnut charts of the affected organ systems due to variants in MIGs. Size of doughnut charts represents the number of MIGs that can result in a symptom related to the respective organ system when affected. If variants in MIGs were associated with several diseases that contained overlapping symptoms, then these symptoms were only counted once. Moreover, if different variants within the same gene were associated with the same symptoms, this symptom was also only included once. The three most prevalent phenotypes are listed in the ring based on their relative occurrence. Color‐coding of the organ systems is the same as in Figure 1. IUGR, intrauterine growth retardation; FS, focal segmental; HI, hearing impairment; DSM, delayed skeletal maturation
