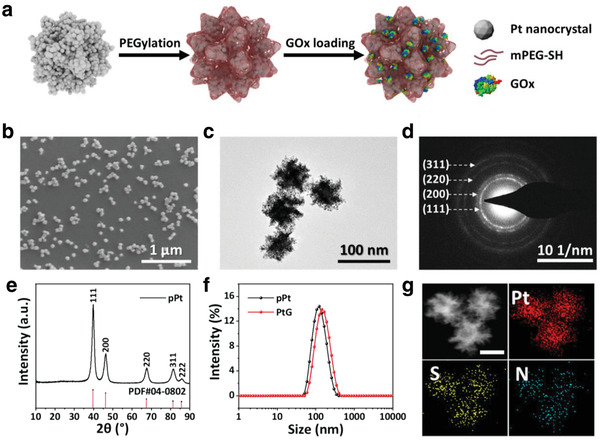
Figure 1.

a) Illustration of the synthetic procedure of PtGs. b) Scanning electron microscope (SEM) image of pPts. c) Typical transmission electron microscope (TEM) image and d) corresponding SAED pattern of pPts. e) XRD patterns of pPts. f) DLS analysis of pPts and PtGs in PBS. g) Energy dispersive spectroscopy (EDS) element mapping of PtGs (scale bar: 50 nm).
