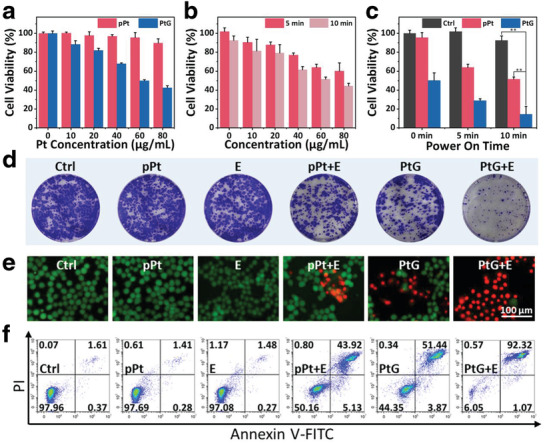
Figure 3.

In vitro cytotoxicity assay. a) 4T1 cells viabilities treated with varied concentrations of pPts and PtGs for 24 h. b) Relative cell viabilities of 4T1 cells treated with pPts after agitated by a square‐wave current (5 mA, 10 mHz) for 5 or 10 min. c) Synergistic cell‐killing effect of PtGs with an electric field. p‐values: **p < 0.01. d–f) Corresponding colony formation, Live&Dead staining images, and quantitative flow cytometry analysis of cell apoptosis/necrosis of 4T1 cells treated with all seven groups.
