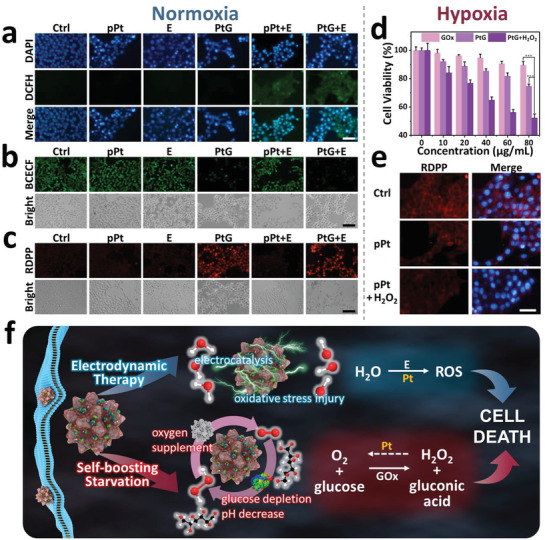
Figure 4.

Cellular abnormalities induced by electric field and starvation. Fluorescence images of a) intracellular ROS (scale bar: 100 µm), b) pH (scale bar: 200 µm), and c) oxygen (scale bar: 200 µm) in 4T1 cells cultured with different sample groups under a normoxia condition. d) Relative cell viabilities of 4T1 cells incubated with free GOx, PtGs, and PtGs+H2O2 under a hypoxic condition for 24 h. p‐values: ***p < 0.001. e) RDPP fluorescence in 4T1 cells treated with pPts in the absence and presence of H2O2 under a hypoxic condition (scale bar: 100 µm). f) Mechanism illustration of inhibition effect induced by PtGs.
