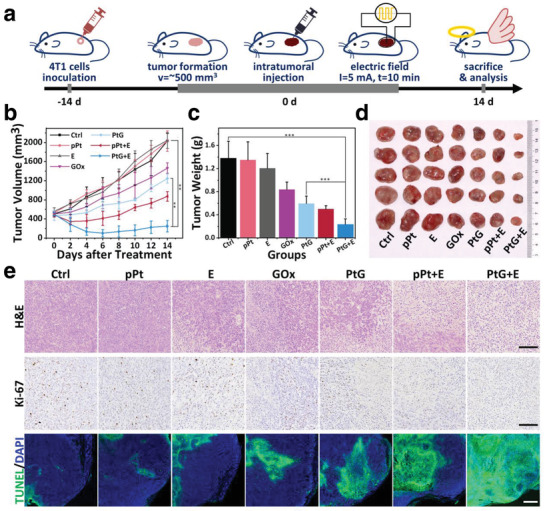
Figure 5.

In vivo antitumor efficacy. a) Demonstration of the treatment process. b) Variation of tumor volume after different treatments by all sample groups (n = 5). c) Average tumor weight on day 14 after various treatments. d) Photographs of tumors harvested from different treatment groups. e) H&E staining (scale bar: 100 µm), Ki‐67 staining (scale bar: 100 µm), and TUNEL staining (scale bar: 500 µm) images of tumor tissue collected from different mice groups 24 h after treatments. p‐values: ***p < 0.001, **p < 0.01.
