-
A
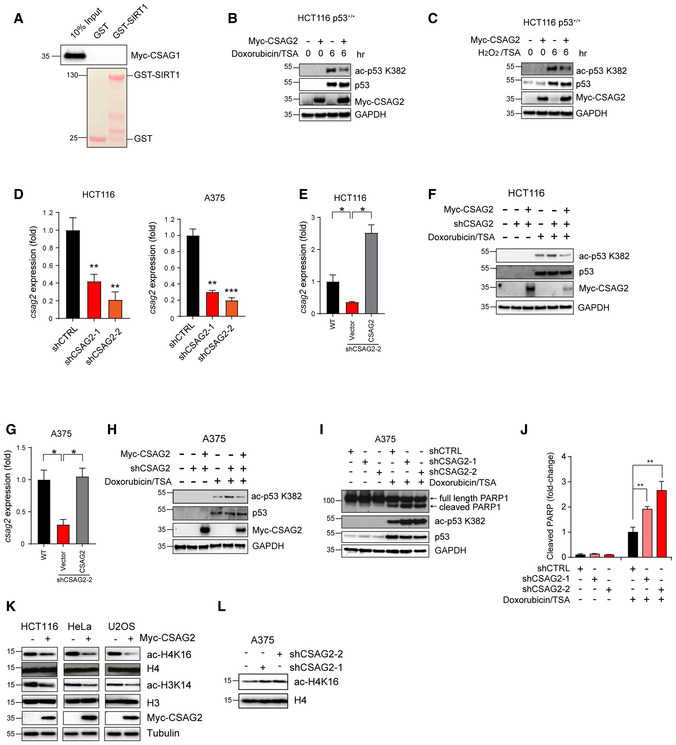
CSAG1 does not bind SIRT1 in vitro. Myc‐tagged CSAG1 was in vitro translated followed by in vitro binding assays with recombinant GST or GST‐SIRT1, SDS–PAGE, and immunoblotting for anti‐Myc.
-
B, C
Expression of CSAG2 decreased p53 ac‐K382 levels in HCT116 cells. Cells were treated with either 1 μM Doxorubicin (B) or 1 mM H2O2 (C) and 0.4 μM TSA for indicated times. Cells were then harvested and blotted for the indicated proteins.
-
D
CSAG2 mRNA levels were determined by qRT–PCR (n = 3 biological replicates) in the indicated cell types.
-
E–H
Re‐expression of CSAG2 rescued p53 ac‐K382 levels in CSAG2 knockdown stable cell lines. Myc‐CSAG2 was transfected in HCT116 (E‐F) or A375 (G‐H) CSAG2 knockdown stable cell lines. CSAG2 mRNA levels were determined by qRT–PCR (n = 3 biological replicates) (E and G). Cells were treated with 1 μM doxorubicin/0.4 μM TSA for 6 h and then blotted for the indicated proteins (F and H).
-
I, J
A375 cells were transiently transfected with the indicated shRNAs for 48 h before treatment with 1 μM doxorubicin/0.4 μM TSA for 6 h. Cell lysates were collected and blotted for the indicated proteins (I). Quantitation (n = 3 biological replicates) of normalized cleaved PARP levels is shown (J).
-
K
HeLa, U2OS, or HCT116 cells were transfected with Myc‐Vector (−) or Myc‐CSAG2 (+) for 48 h. Cell lysates were blotted for the indicated proteins.
-
L
Knockdown of endogenous CSAG2 in A375 cells increased ac‐H4K16 levels. Cell lysates were blotted for the indicated proteins.
Data information: Data are represented as the mean ± SD. *
‐test.

