-
A, B
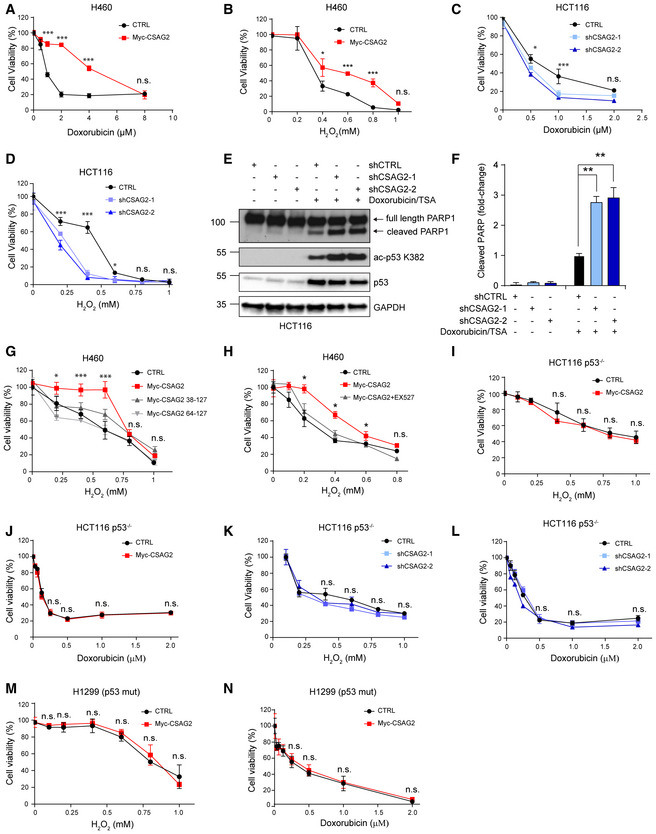
Control or CSAG2 expressing H460 cells were treated with the indicated concentrations of doxorubicin (A) or H2O2 (B) for 24 h before cell viability was determined by alamarBlue (n = 6 biological replicates).
-
C, D
shCTRL, shCSAG2‐1, or shCSAG2‐2 stable HCT116 cells were treated with the indicated concentrations of doxorubicin (C) or H2O2 (D) for 24 h before cell viability was determined by alamarBlue (n = 6 biological replicates).
-
E, F
HCT116 cells were transiently transfected with the indicated shRNAs for 48 h before treatment with 1 μM doxorubicin/0.4 μM TSA for 6 h. Cell lysates were collected and blotted for the indicated proteins (E). Quantitation (n = 3 biological replicates) of normalized cleaved PARP levels is shown (F).
-
G
H460 cells were transfected with wild type, Δ37, or Δ63 CSAG2 for 48 h. Cells were then treated with the indicated concentrations of H2O2 for 24 h before cell viability was determined by alamarBlue (n = 6 biological replicates).
-
H
Inhibition of SIRT1 activity abolished CSAG2 induced cell survival under genotoxic stress. CSAG2 overexpressing H460 cells were treated with the indicated concentrations of H2O2 with or without 1 μM EX‐527 for 24 h before cell viability was determined by alamarBlue (n = 6 biological replicates).
-
I, J
Control or Myc‐CSAG2 expressing HCT116 p53−/− cells were treated with the indicated concentrations of H2O2 (I) or doxorubicin (J) for 24 h before cell viability was determined by alamarBlue (n = 6 biological replicates).
-
K, L
shCTRL, shCSAG2‐1, or shCSAG2‐2 stable HCT116 p53−/− cells were treated with the indicated concentrations of H2O2 (K) or doxorubicin (L) for 24 h before cell viability was determined by alamarBlue (n = 6 biological replicates).
-
M, N
Control or Myc‐CSAG2 expressing H1299 (p53 mutant) cells were treated with the indicated concentrations of H2O2 (M) or doxorubicin (N) for 24 h before cell viability was determined by alamarBlue (n = 6 biological replicates).
Data information: Data are represented as the mean ± SD. *
‐test.

