-
A
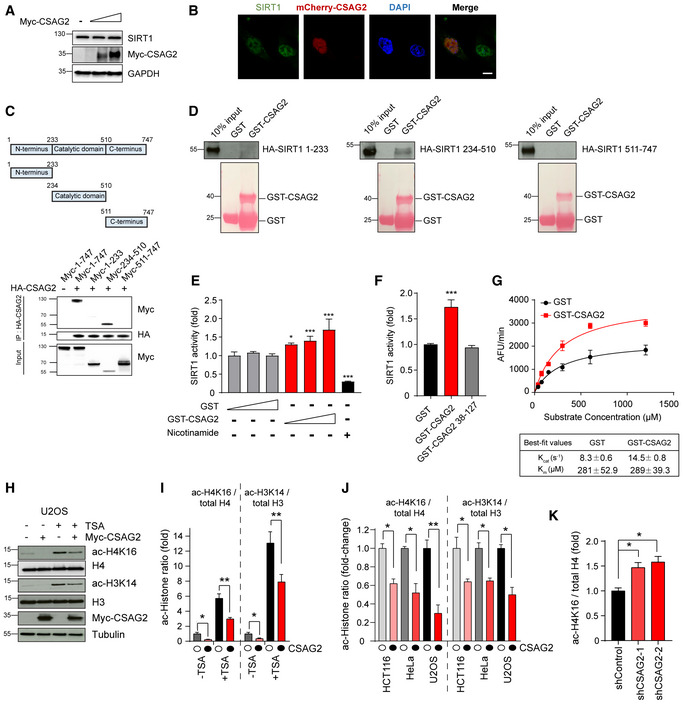
CSAG2 does not alter SIRT1 protein levels. HEK293FT cells were transfected with different amounts of Myc‐CSAG2 for 48 h before cells lysates were harvested and immunoblotted for indicated proteins.
-
B
CSAG2 does not alter SIRT1 subcellular location. U2OS cells were transfected with or without mcherry‐CSAG2 for 48 h before fixation, SIRT1 immunostaining, and imaging. Scale bar: 10 μm.
-
C
Summary of results mapping interaction region of SIRT1 recognized by CSAG2. HEK293FT cells stably expressing HA‐CSAG2 were transfected with indicated Myc‐SIRT1 constructs for 48 h before IP with anti‐HA followed by SDS–PAGE and immunoblotting for anti‐Myc.
-
D
CSAG2 directly binds SIRT1 catalytic domain in vitro. HA‐tagged SIRT1 fragments were in vitro translated. In vitro binding assays with recombinant GST or GST‐CSAG2 were performed followed by SDS–PAGE and immunoblotting for anti‐HA.
-
E
CSAG2 enhances SIRT1 activity in vitro. In vitro SIRT1 activity toward p53 ac‐K382 peptide was determined in the presence of GST or GST‐CSAG2, n = 3 biological replicates. Nicotinamide (1 mM) was added to the reaction were indicated to block SIRT1 activity.
-
F
CSAG2 Δ37 mutant that does not bind SIRT1 does not enhance SIRT1 activity in vitro. In vitro SIRT1 activity toward p53 ac‐K382 peptide was determined in the presence of GST, GST‐CSAG2 or GST‐CSAG2 38–127, n = 3 biological replicates.
-
G
CSAG2 enhances SIRT1 deacetylation of p53 ac‐K382 peptide through increasing kcat, but not Km. not affecting the binding ability with its substrate p53. SIRT1 activity assays were performed as described above, except varying amounts of p53 ac‐K382 fluorometric peptide were used in the presence of saturating NAD+ (3 mM), n = 3 biological replicates.
-
H, I
U2OS cells were transfected with Myc‐Vector or Myc‐CSAG2 for 48 h before being treated with or without 0.4 μM TSA for 6 h. Cell lysates were blotted for the indicated proteins (H). Quantitation of expression levels of acetylated histone relative to total histone is shown as the mean ± SD, n = 3 biological replicates. White circles indicate Myc‐Vector and black circles indicate Myc‐CSAG2.
-
J
HeLa, U2OS, or HCT116 cells were transfected with Myc‐Vector or Myc‐CSAG2 for 48 h. Cell lysates were blotted for the indicated proteins. Quantitation of expression levels of acetylated Histone relative to total Histone is shown as the mean ± SD, n = 3 biological replicates. White circles indicate Myc‐Vector and black circles indicate Myc‐CSAG2.
-
K
Knockdown of endogenous CSAG2 in A375 cells increased ac‐H4K16 levels. Cell lysates were blotted for the indicated proteins. Quantitation of expression levels of ac‐H4K16 relative to total H4 is shown as the mean ± SD, n = 3 biological replicates.
Data information: Data are represented as the mean ± SD (E‐G). *
‐test.

