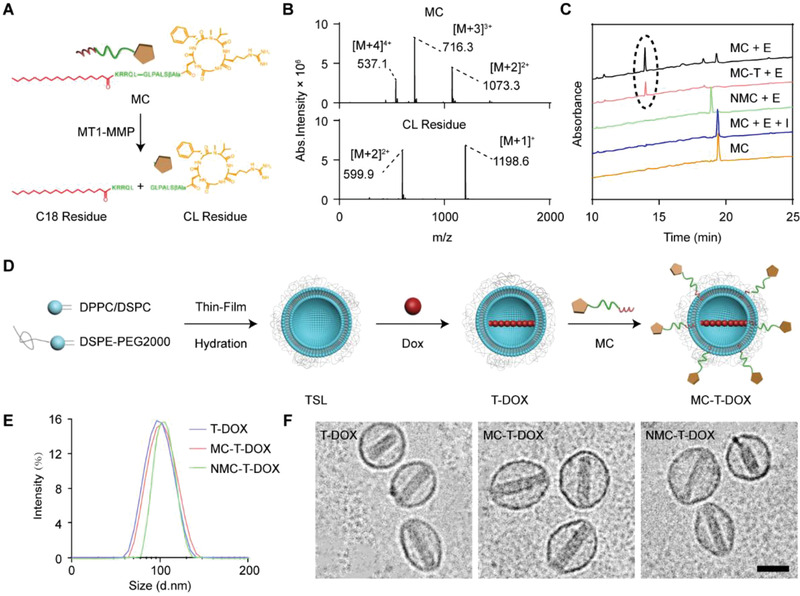
Figure 1.

Preparation and characterization of MC‐T‐DOX. A) Schematic illustration of MC cleavage by MT1‐MMP to release cilengitide. B) MS spectrum of (upper row) MC (MW: 2145.3) and (lower row) the degradation peak (cilengitide (CL) residue; MW: 1197.6) C) HPLC chromatograms of MT1‐MMP‐mediated cleavage of cilengitide from MC. The black circle indicates the peak of cilengitide residue. “E” indicates membrane type 1‐matrix metalloproteinase. “I” indicates the matrix metalloproteinase inhibitor GM6001. D) Schematic illustration of the preparation procedure of MC‐T‐DOX. E) Size distribution and F) Cryo‐TEM images of T‐DOX, MC‐T‐DOX and NMC‐T‐DOX. Scale bar: 100 nm.
