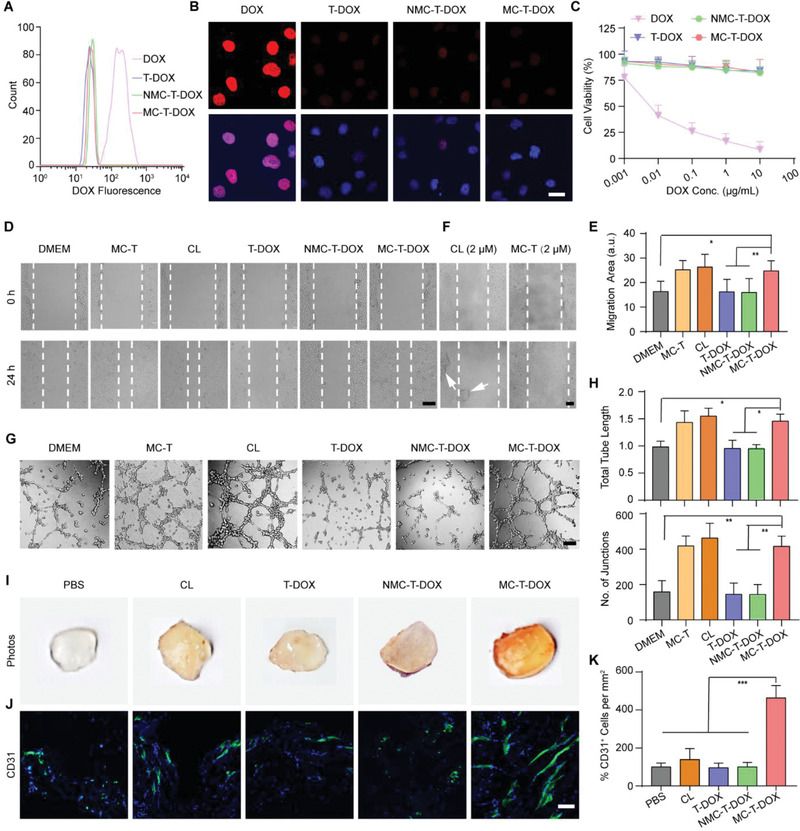
Figure 3.

Proangiogenic effect of MC‐T‐DOX. A) Representative flow cytometry histograms and B) confocal images of cell uptake of DOX for the indicated formulations by HUVECs. Scale bar: 20 µm. C) HUVECs were incubated with the indicated formulations for 24 h and the cytotoxicity was measured through MTT assay (n = 6). D) Representative micrographs of HUVEC migration at 0 and 24 h at an identical cilengitide concentration of 2 nm and E) quantitative analysis after 24 h of migration measured as migration area (n = 8). Scale bar: 200 µm. F) Representative micrographs of HUVEC migration at 0 and 24 h at an identical cilengitide concentration of 2 µm. White arrows indicate the detached HUVEC clusters. Scale bar: 200 µm. G) Representative tube‐like structures and H) quantitative analysis of average number of junctions and total tube length after 8 h of incubation at an identical cilengitide concentration of 2 nm (n = 8). Scale bar: 200 µm. I) Representative macroscale photographs and J) anti‐CD31 antibody immunofluorescence staining (blue: cell nuclei; green: anti‐CD31 antibody) of Matrigel plugs on posttreatment day 12. Scale bar: 50 µm. K) Percentage of CD31+ ECs per mm2 in each group relative to that in the PBS group (n = 8). CL: cilengitide. Data are presented as mean ± SD. *p < 0.05, **p < 0.01, ***p < 0.001 among the marked groups using nonparametric two‐tailed analysis of variance.
