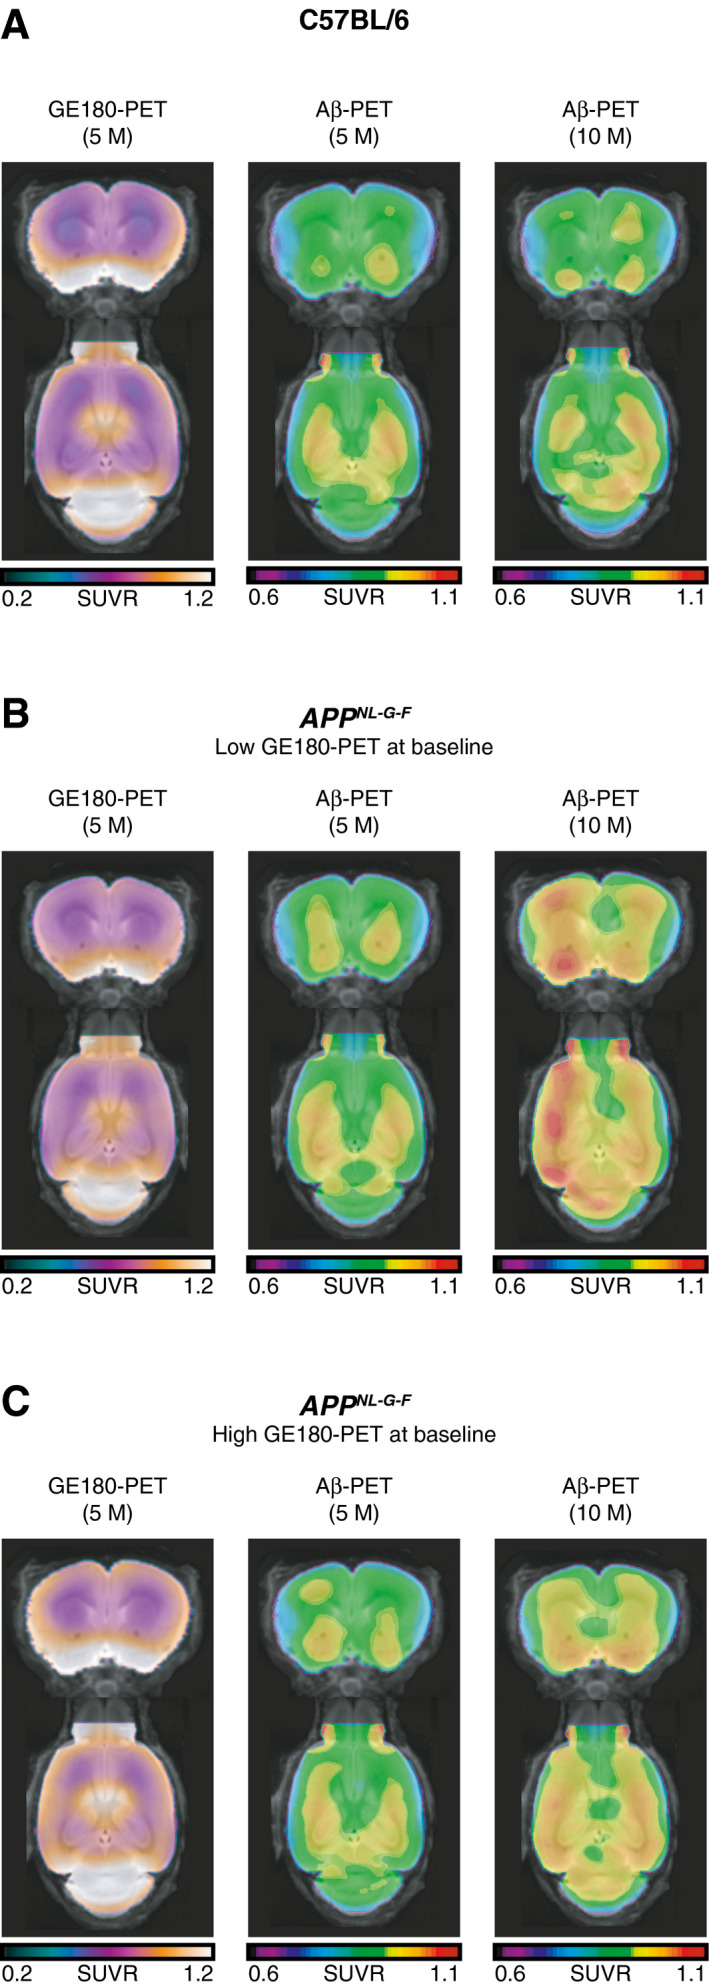
Figure 3. Brain rendering of GE180 and Florbetaben PET by group and time point.

-
A–CCoronal (top row) and axial (bottom row) slices of average 18‐F GE-180 TSPO (microglia) tracer and 18F‐florbetaben amyloid PET split up by group (A–C): C57BL/6 (A), APPNL‐G-F mice subgroup with a low (< median) GE‐180 PET (B), and the APPNL‐G-F mice subgroup with a high (> median) GE‐180 PET (C). APPNL‐G-F mice with low baseline GE180 PET levels showed faster increase in Florbetaben PET between 5 and 10 months (B) compared to those at high baseline level of GE‐180 PET (C).
