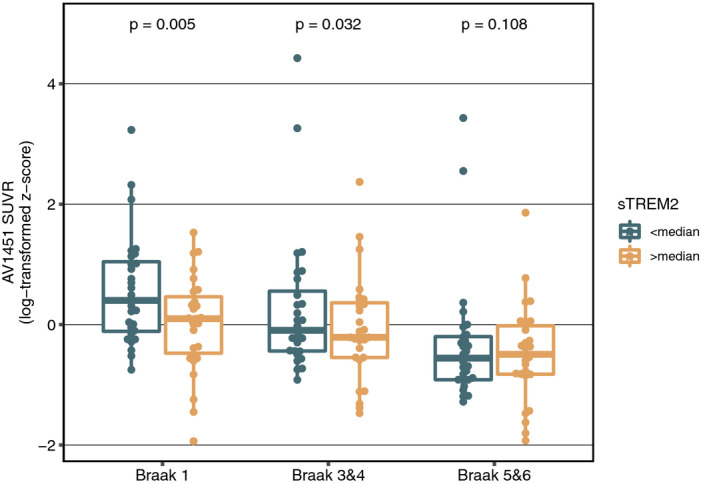
Figure 4. TREM2 vs. tau PET.

Effects of sTREM2 on AV1451‐PET‐assessed tau pathology stratified by Braak stages shown as boxplots (central band = median, boxes = quartiles, whiskers = 1.5 * interquartile range).Source data are available online for this figure.
