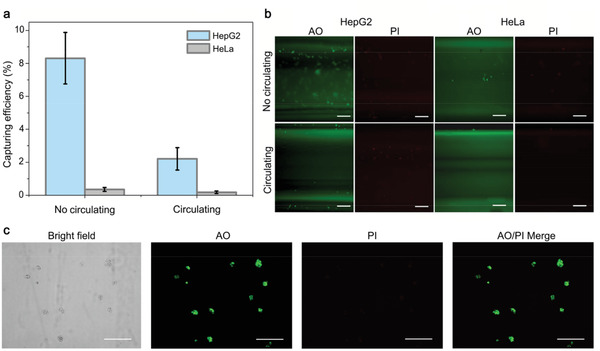
Figure 4.

In vitro capture of the CTCs. a) Cell capture efficiency under no‐circulating and circulating conditions. b) AO and PI co‐staining of captured cells. Representative fluorescent images of HepG2 and HeLa cells bound on the catheter after incubation under no‐circulating and circulating conditions. c) AO and PI co‐staining of the eluted HepG2 cells after 72 h of culture. Error bars represent the standard deviation of three independent measurements. Scale bar, 200 µm.
