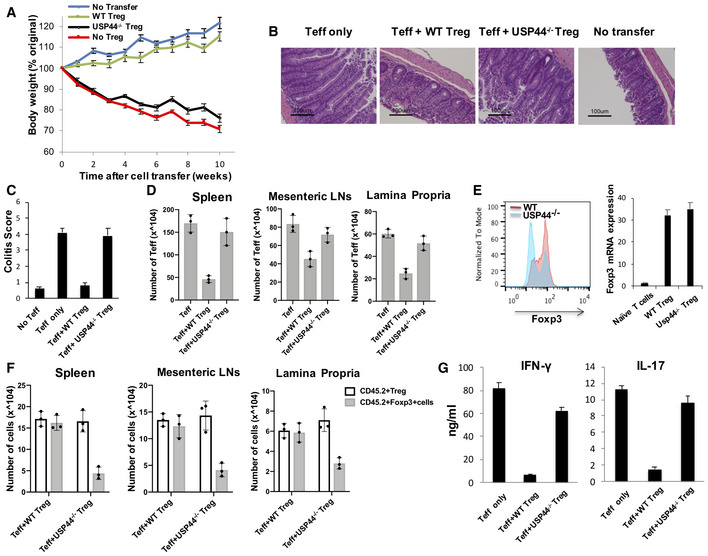
Colitis was induced by intravenous coinjection of CD4+ CD25‐CD62Lhigh T cells and congenically distinct (CD45.2) CD4+ CD25high Treg cells into Rag2−/− mice (n = 8/group; 1 × 10⁶ and 2 × 10⁵ cells per Rag2−/− recipient, respectively). Changes in body weight over time were monitored and are expressed as a percentage of the original weight.
Representative photomicrographs of the distal colon of Rag2−/− mice after T cell transfer. 10 weeks after transfer, mice were euthanized, and colons were harvested, fixed in 10% buffered formalin, and processed for standard H&E staining prior to histological analysis. (i)‐ (iv) present bright‐field micrographs (100×).
H&E slides were scored in a blinded fashion, and colon pathology was scored as described in the Materials and Methods section. Shown are mean scores for each treatment group.
Spleen, mesenteric, and lamina propria lymph node cells were isolated from the mice 10 weeks after adoptive T cell transfer, and the number of Teff cells was determined by flow cytometry.
Expression of FOXP3 protein and mRNA by adoptively transferred Tregs. Mesenteric lymph nodes were excised from the recipients of WT and USP44−/− Tregs in A. FOXP3 protein was detected by intracellular immunostaining and flow cytometry (left). Shown are events within the gate for transferred Tregs (CD4+/CD45.1+). Transferred Tregs were also recovered from mesenteric lymph node cell suspensions by staining for the congenic marker and CD4 followed by FACS, and Foxp3 mRNA was measured in these recovered Tregs by RT–PCR (right).
Cell numbers of injected (CD45.2+) Treg cells and FOXP3+ cells were determined by flow cytometry.
CD4+ T cells were recovered from suspensions of lamina propria‐infiltrating leukocytes. These lymphocytes were stimulated ex vivo by PMA/Ionomycin cocktail in the presence of brefeldin A, and IFN‐γ and IL‐17 production by these lymphocytes was analyzed by ELISA.
Data information: Panel (A) shows the mean weight changes for each group in a representative experiment. Panel (B) depicts representative micrographs from all colons processed (
= 8/group/experiment), and all others depict the mean results of at least three experiments ± SD (panel (C)) or ± SEM (all others).

