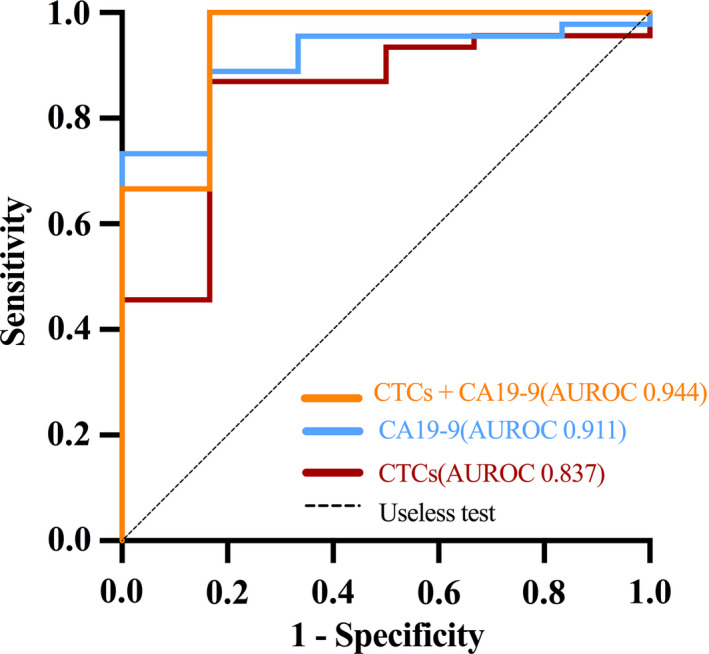
FIGURE 4.

ROC curves showing the diagnostic performance of FR+ CTCs, CA19‐9 and their combination. FR+ CTCs, folate receptor‐positive circulating tumour cells; CA19‐9, carbohydrate antigen 19‐9; ROC, receiver‐operating characteristic; AUROC, area under the ROC curve
