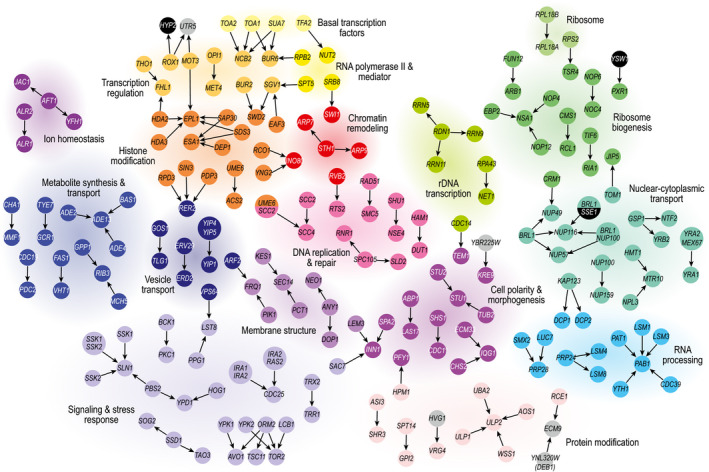
Figure 2. Network of bypass suppression interactions.

Bypass suppressor interactions are represented as arrows that point from the bypass suppressor gene to the essential query gene. Nodes are colored and grouped based on the function of the gene(s). Gray nodes indicate genes that are poorly characterized, whereas black nodes highlight genes with functions that are not otherwise represented in the figure. Complex suppression interactions involving two suppressor genes are represented by larger nodes.
