-
A
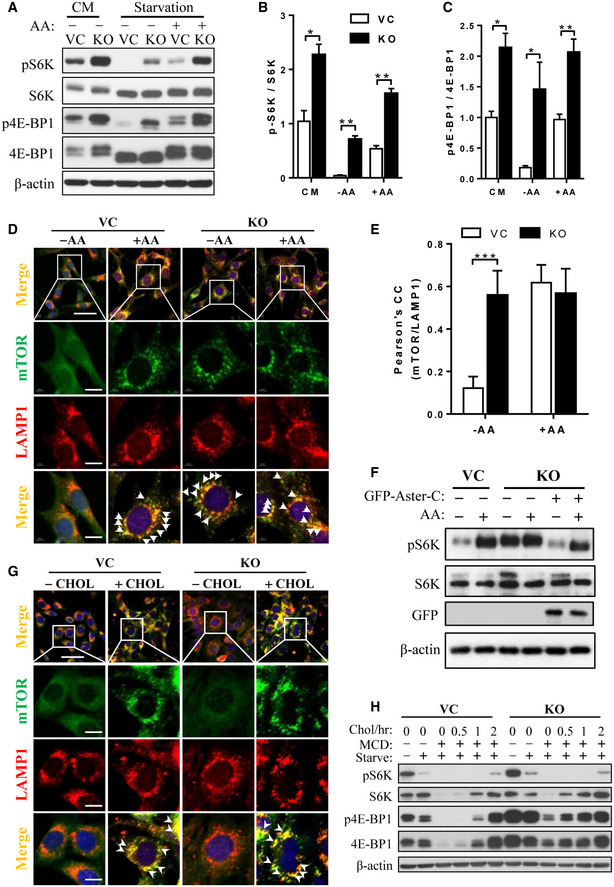
Western blot analysis of mTORC1 activity in C2C12‐Vector (VC) and Aster‐C KO (KO) cells in complete medium (CM) and in response to nutrient starvation or stimulation with amino acids for 30 min.
-
B, C
Statistical analysis of phosphorylated levels of S6K (B) and 4E‐BP1 (C) in C2C12‐Vector and Aster‐C KO cells in CM, under nutrient starvation (−AA) and in response to stimulation with amino acids (+AA) using ImageJ software. Data are represented as mean ± SD (n = 3 biological replicates). *P < 0.05, **P < 0.01 by Student's t test.
-
D
Immunostaining of endogenous mTOR and LAMP1 in C2C12‐Vector and Aster‐C KO cells under nutrient starvation (−AA) and in response to AA stimulation (+AA). LAMP1 was immunostained as a lysosome marker. Arrows highlight the co‐localization of mTOR with LAMP1. Scale bar, 40 μm (Row 1) and 10 μm (Rows 2, 3, 4).
-
E
Statistical analysis of the Pearson's correlation coefficient of mTOR and LAMP1 in Fig
1D (
n = 12–15 cells per group). Data are represented as mean ± SD. ***
P < 0.001 by one‐way ANOVA.
-
F
Western blot analysis of mTORC1 activity in Aster‐C KO cells stably re‐expressing exogenous GFP‐Aster‐C under nutrient starvation and AA stimulation. Aster‐C KO cells were transfected with GFP‐Aster‐C and selected with G418 for 2 weeks.
-
G
Immunostaining of endogenous mTOR and LAMP1 in C2C12‐Vector and Aster‐C KO cells under cholesterol depletion by treatment with 0.5% MCD for 2 h (−CHOL) or cholesterol (50 μM) re‐stimulation for 1 h (+CHOL). Arrows highlight the co‐localization of mTOR with LAMP1. Scale bar, 40 μm (Row 1) and 10 μm (Rows 2, 3, 4).
-
H
Western blot analysis of mTORC1 activity in C2C12‐Vector and Aster‐C KO cells in CM, under starvation, cholesterol depletion by treatment with 0.5% MCD for 2 h or cholesterol (50 μM) re‐stimulation for the indicated time.
Data information: Data are representative of at least three independent experiments.

