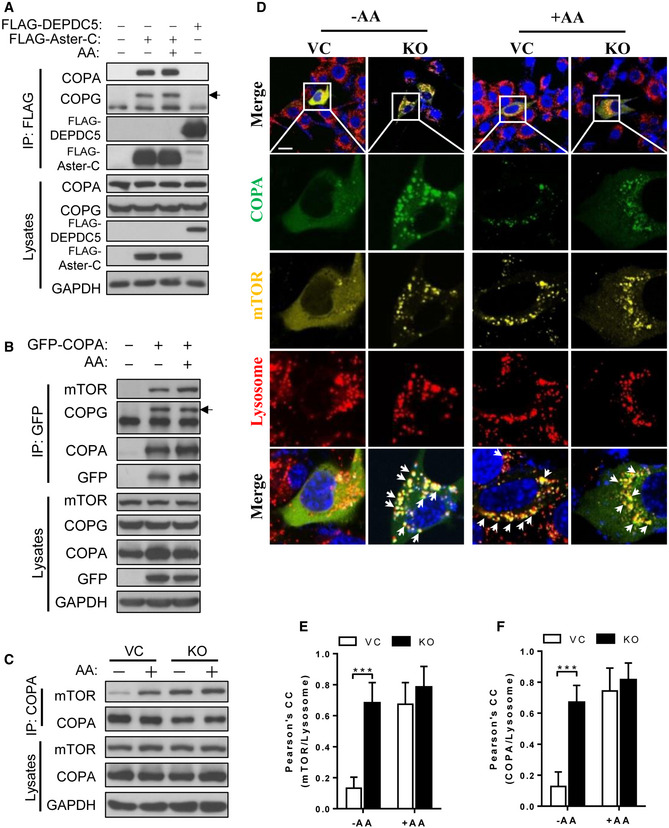
Figure 3. COP I vesicle assembly is required for the trafficking, activation and lysosomal association of mTORC1.

-
ACo‐IP analysis of the interaction of Aster‐C with COPA and COPG in response to starvation and AA stimulation using FLAG‐DEPDC5 as a negative control in HEK293T cells transiently expressing the indicated proteins. Anti‐FLAG antibody was used for immunoprecipitation. Black arrow indicates the COPG protein.
-
BCo‐IP analysis of the interaction of COPA with mTOR in HEK293T cells transiently expressing GFP‐COPA in response to starvation and AA stimulation. Anti‐GFP antibody was used for immunoprecipitation. Black arrow indicates the COPG protein.
-
CCo‐IP analysis of the interaction of COPA with mTOR in C2C12‐Vector and Aster‐C KO cells in response to starvation and AA stimulation. Anti‐COPA antibody was used for immunoprecipitation.
-
DConfocal imaging analysis depicting the co‐localization of YFP‐mTOR (yellow) with GFP‐COPA (green) and lysosomes (red) in live C2C12‐Vector and Aster‐C KO cells in response to nutrient starvation and re‐stimulation by AA. Arrows highlight co‐localization of mTOR, COPA, and lysosomes. Scale bar, 20 μm.
-
E, FStatistical analysis of the Pearson's correlation coefficient of mTOR/Lysosome (E) and COPA/Lysosome (F) in Fig 3D (n = 10–12 cells per group). Data are represented as mean ± SD. ***P < 0.001 by one‐way ANOVA.
