
FIGURE 1.
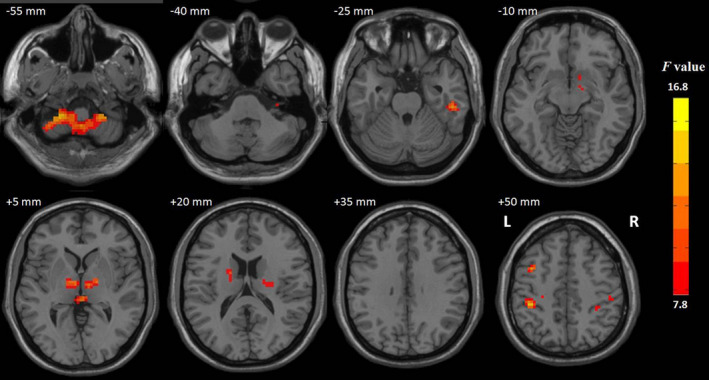
Red indicates that the three groups had significant ALFF differences (p < .001, TFCE corrected). L, left; R, right
Official websites use .gov
A
.gov website belongs to an official
government organization in the United States.
Secure .gov websites use HTTPS
A lock (
) or https:// means you've safely
connected to the .gov website. Share sensitive
information only on official, secure websites.
Red indicates that the three groups had significant ALFF differences (p < .001, TFCE corrected). L, left; R, right