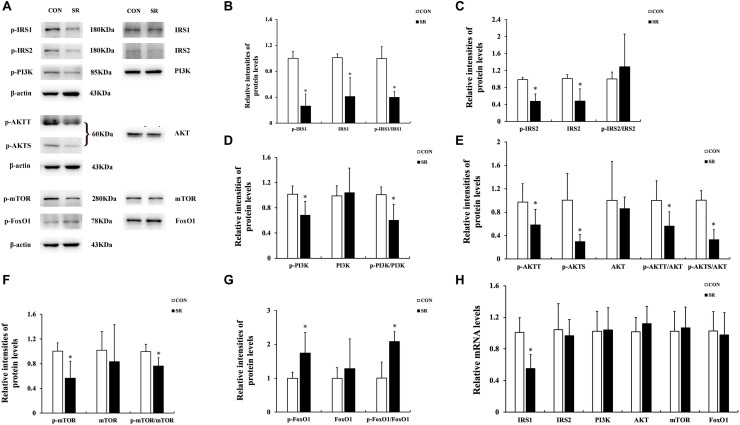
FIGURE 3.
Sleep restriction attenuated IRS/PI3K/AKT signaling pathways. (A) Western blot analysis. Images are representative of five independent experiments for each group. (B) Densitometric analysis of Western blots for p-IRS1, IRS1, and the p-IRS1/IRS1 ratio. (C) Densitometric analysis of Western blots for p-IRS2, IRS2, and the p-IRS2/IRS2 ratio. (D) Densitometric analysis of Western blots for p-PI3K, PI3K, and the p-PI3K/PI3K ratio. (E) Densitometric analysis of Western blots for p-AKTT, p-AKTS, AKT, p-AKTT/AKT ratio, and the p-AKTS/AKT ratio. (F) Densitometric analysis of Western blots for p-mTOR, mTOR, and the p-mTOR/mTOR ratio. (G) Densitometric analysis of Western blots for p-FoxO1, FoxO1, and the p-FoxO1/FoxO1 ratio. The relative intensity in arbitrary units compared to β-actin and presented as fold change vs. control sample. (H) Quantitation of IRS1, IRS2, PI3K, AKT, mTOR, and FoxO1 mRNA by real-time RT-PCR. The gene expression was normalized to GAPDH and presented as fold change vs. the control. Data were expressed as the mean ± SD of six experiments and analyzed by independent-sample t-test. Significant differences were defined as *p < 0.05 vs. control group. SR, sleep restriction group; CON, control group.

