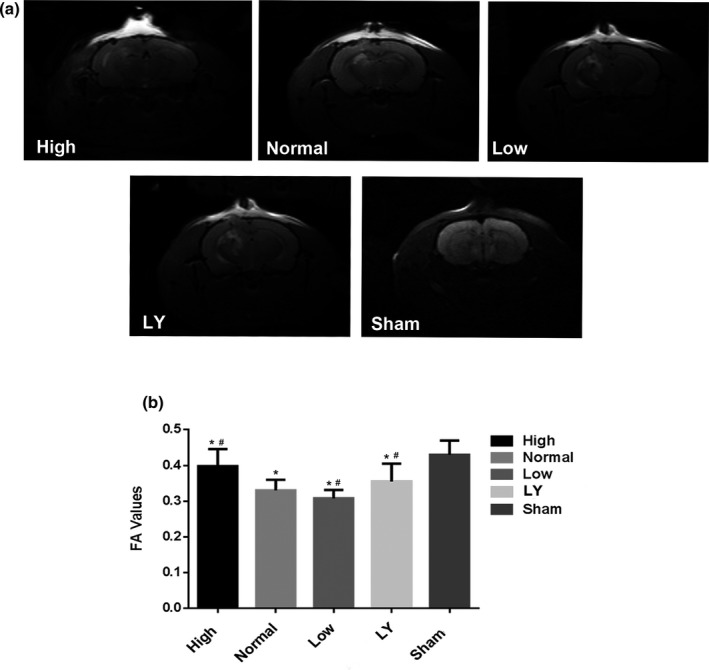
Figure 5.

Effects of estrogen on the DTI (FA values) in each group. (a) A DTI scan sequence; (b) FA values in each group; all the data were represented as means ± SD; *p < .05 indicated compared with the Sham group; # p < .05 indicated compared with the normal estrogen group. The rats in the Sham group received sham operation of scalp incision as a negative control; in all the other four groups, the rats were received a subcortical axonal fiber injury surgery as the test groups
