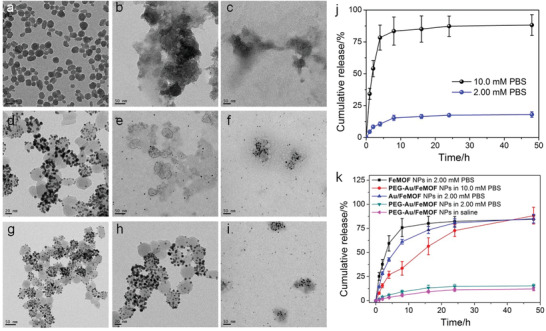
Figure 2.

TEM images of a) FeMOF NPs, d) Au/FeMOF NPs, and g) PEG‐Au/FeMOF NPs in water. TEM images of b) FeMOF NPs, e) Au/FeMOF NPs, and h) PEG‐Au/FeMOF NPs in PBS (2.00 × 10⁻³ m). TEM images of c) FeMOF NPs, f) Au/FeMOF NPs, and i) PEG‐Au/FeMOF NPs in PBS (10.0 × 10⁻³ m). j) Release profiles of gold from PEG‐Au/FeMOF NPs in PBS containing different phosphate concentrations. k) Release profiles of the porphyrin ligands from FeMOF NPs, Au/FeMOF NPs, or PEG‐Au/FeMOF NPs under different conditions. In (j,k), data represent mean ± s.d. from four independent replicates.
