
Figure 3.
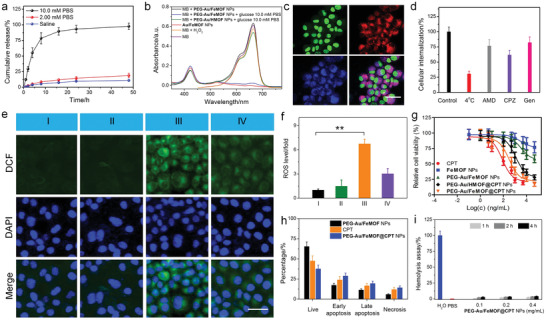
a) Cumulative release curves of CPT from PEG‐Au/FeMOF@CPT NPs in solutions containing different concentrations of phosphate ions. b) UV‐vis spectra of MB solution after reaction with different formulations. c) CLSM images of HepG2 cells incubated with PEG‐Au/FeMOF@CPT NPs for 8 h. Green fluorescence indicates nucleus from Syto‐9; red fluorescence is attributed to TCPP(Fe); blue fluorescence is attributed to CPT. Scale bar is 50 µm. d) Cellular internalization of PEG‐Au/FeMOF NPs under different conditions. e) CLSM images of HepG2 cells stained with DCF and f) quantitative determination of intracellular ROS changes in different groups: I, control; II, FeMOF NPs; III, PEG‐Au/FeMOF NPs; IV, PEG‐Au/HMOF NPs. Green fluorescence reflects the ROS level. Scale bar is 50 µm. g) MTT assay of HepG2 cells after 24 h incubation with CPT, FeMOF NPs, PEG‐Au/FeMOF NPs, PEG‐Au/HMOF@CPT NPs, or PEG‐Au/FeMOF@CPT NPs. h) Cell apoptosis determined by Annexin‐V/PI analyses after 48 h incubation. i) Hemolysis assay of PEG‐Au/FeMOF NPs at various concentrations. In (a,d,f,h,i), data represent mean ± s.d. from four independent replicates. In (g), data represent mean ± s.d. from six independent replicates. p Values were calculated using one‐way analysis of variance (ANOVA) with Tukey's honest significant difference post hoc test (**p < 0.01).