Figure 4.

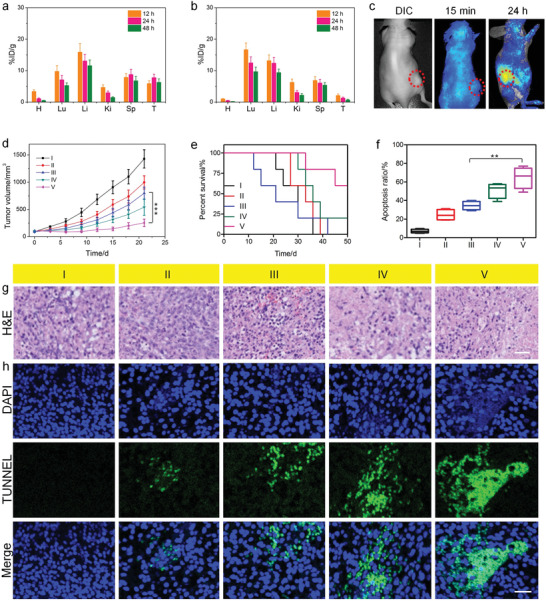
Time‐dependent tissue distributions of CPT for the mice injected with a) PEG‐Au/FeMOF@CPT NPs and b) CPT. H, heart; Lu, lung; Li, liver; K, kidney; Sp, spleen; T, tumor. c) Fluorescence imaging of the mice post i.v. injection of PEG‐Au/FeMOF@CPT NPs at 15 min and 24 h. d) Tumor growth curves and e) survival ratio of the mice bearing HepG2 tumors received different treatments. f) Apoptosis ratio of the tumor cells in different groups. g) H&E and h) TUNEL staining of the tumor tissues in different groups. I, PBS; II, PEG‐Au/FeMOF NPs; III, CPT; IV, PEG‐Au/HMOF@CPT NPs; V, PEG‐Au/FeMOF@CPT NPs. Scale bars in (g) and (h) are 100 and 50 µm, respectively. Data are expressed as mean ± s.d. In (a,b), data represent mean ± s.d. from four independent replicates. In (d–f), data represent mean ± s.d. from five independent replicates. p Values were calculated using one‐way ANOVA with Tukey's honest significant difference post hoc test (**p < 0.01, ***p < 0.001).
