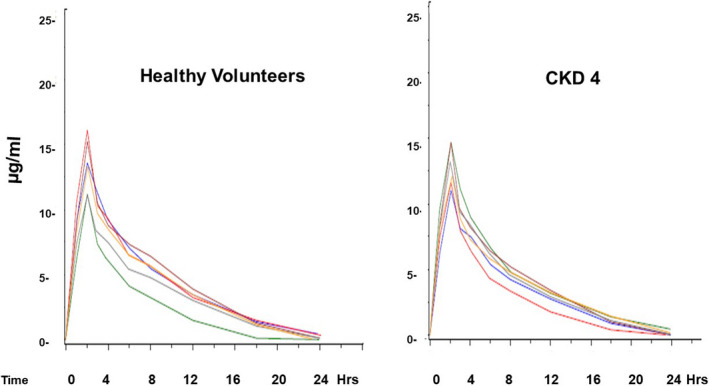
FIGURE 5.

Following SnPP injection, exponential declines in SnPP plasma concentrations occurred. The graphs show “spaghetti plots” of values observed in the six healthy volunteers and six subjects with stage 4 CKD. Despite the marked differences in eGFRs, no significant differences in peak SnPP concentrations, SnPP half‐lives (3.5 hr), or AUCs for the two groups were observed
