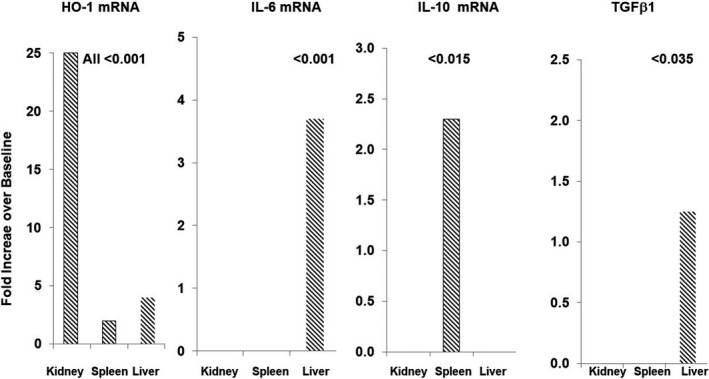
FIGURE 6.

SnPP‐induced fold increases in HO‐1, IL‐6, IL‐10, and TGFβ1 mRNA levels in mouse tissues at 4 hr after SnPP administration. SnPP induced significant increases in HO‐1 mRNA in kidney, liver, and spleen. However, IL‐10 mRNA increases were confined to spleen. Only the liver responded with increases in IL‐6 and TGFβ1 mRNA concentrations. The values represent the mean fold increases over baseline values. Mean values ± SEM are presented in Tables 2, 3, 4
