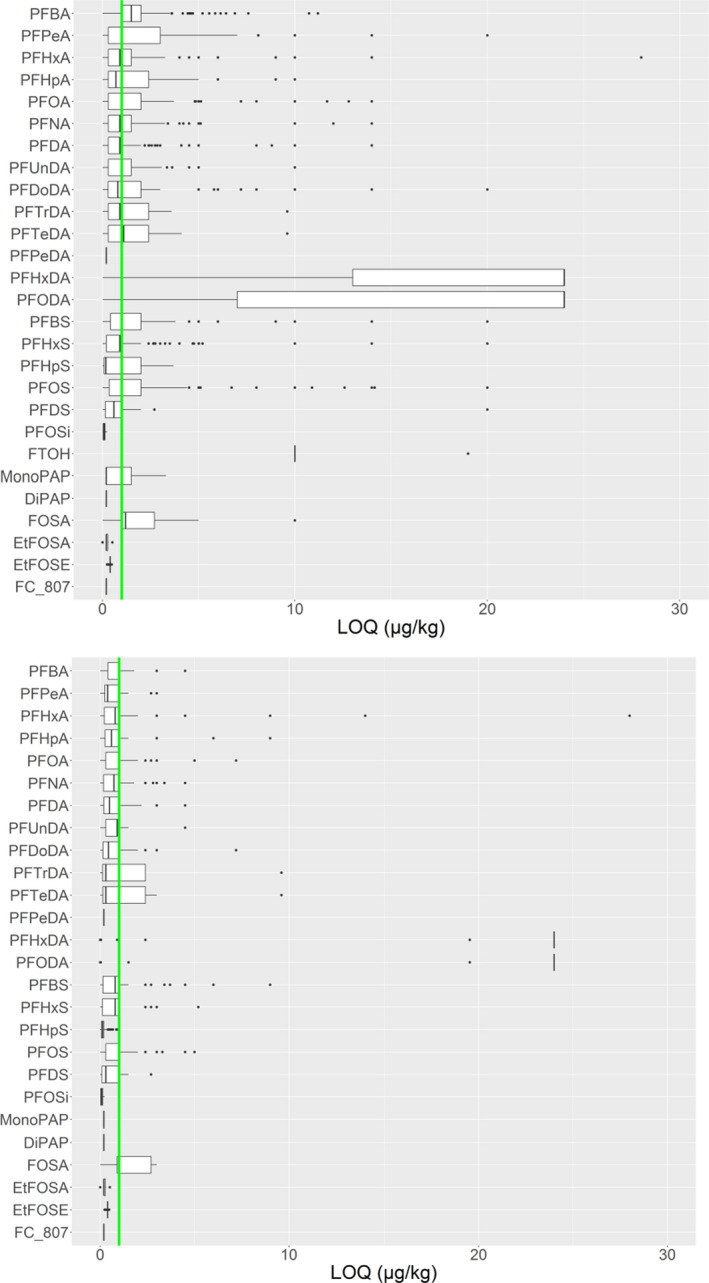
Figure 2.

Distribution of the limits of quantification (LOQs) of PFASs for reported results before (upper figure) and after (lower figure) applying the LOQ cut‐off
- Box plot showing whiskers at minimum and maximum, box at P25 and P75 with line at P50, outliers shown as dots. The vertical green line shows the 1 μg/kg LOQ cut‐off, applied to most foods categories except drinking water (0.01 μg/kg) and ‘Edible offal, game animals’ and ‘Fish offal’ (no cut‐off).
