
Figure K.1–K.3.
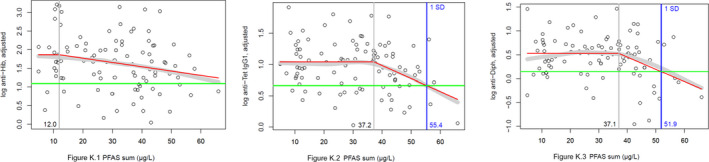
Scatter plot of levels of vaccine antibodies (K.1 Hib, K.2 Tetanus, K.3 Diphtheria) adjusted for the number of vaccinations (in the case of tetanus only) and for the time since the last vaccination for Hib (K.1, n = 98), tetanus IgG1 (K.2, n = 100) and diphtheria (K.3, n = 100), in relation to the PFAS sum (PFOA, PFNA, PFHxS and PFOS) levels
- Titres are presented as log 10 transformed values. Broad grey band: moving average; red line: Fitted ‘knee’ function; horizontal green line: mean minus one standard deviation of the antibody levels below the ‘knee’; vertical grey line: PFAS sum level of the ‘knee’; vertical blue line: PFAS sum level of the ‘knee’ function with antibody levels averagely diminished by one standard deviation.