
Figure K.5.
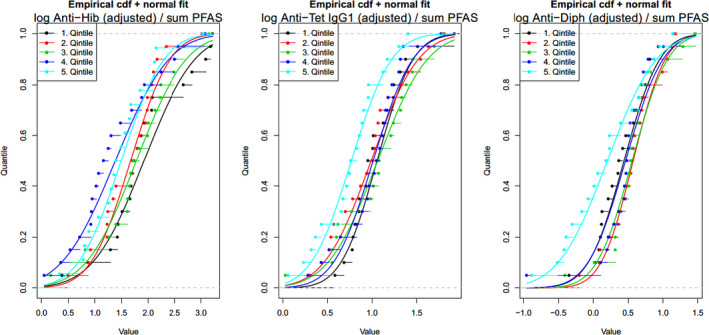
Empirical cumulative distribution functions of PFAS sum (PFOA, PFNA, PFHxS and PFOS) quintiles together with the respective fitted normal distribution curves
- Titres on the X‐axis presented as log 10 transformed values.
Official websites use .gov
A
.gov website belongs to an official
government organization in the United States.
Secure .gov websites use HTTPS
A lock (
) or https:// means you've safely
connected to the .gov website. Share sensitive
information only on official, secure websites.
Empirical cumulative distribution functions of PFAS sum (PFOA, PFNA, PFHxS and PFOS) quintiles together with the respective fitted normal distribution curves