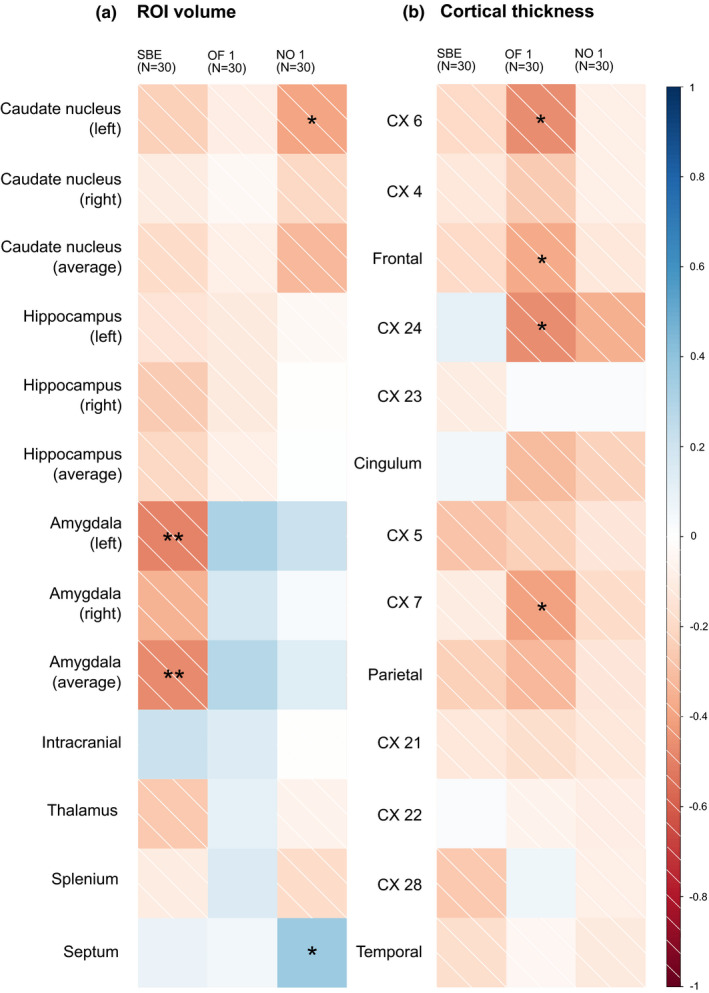
FIGURE 3.

Graphical summary of the correlations between brain morphometry and personality (N = 30). (a) ROI volume‐related analyses; (b) cortical thickness‐related analyses. a, b From left to right: SBE (“shyness”), OF 1 (“exploration”), and NO 1 (“neophilia”); individual squares represent the results of a single correlation analysis (Spearman's). Strength and direction of the correlation are color‐coded according to the legend next to b. Significant correlations are marked with asterisks (significance code: *p ≤ .05; **p ≤ .01)
