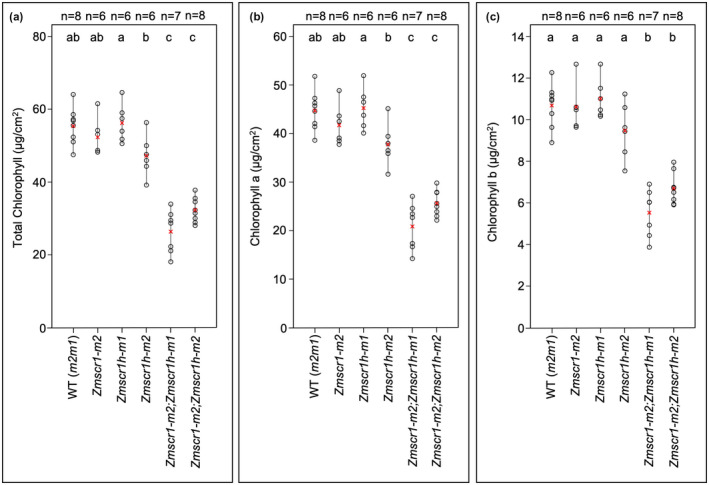
FIGURE 1.

Chlorophyll levels are reduced in Zmscr1;Zmscr1h mutants. Total chlorophyll (a), chlorophyll a (b), and chlorophyll b (c) expressed on a leaf area basis. Biological replicates (n=) are shown above each genotype. Means are shown by a red cross, individual plant datapoints are shown by black open circles. Black lines connect the lowest and highest value in each genotype. Letters at the top of each plot indicate statistically different groups (p < .05, one‐way ANOVA and TukeyHSD)
