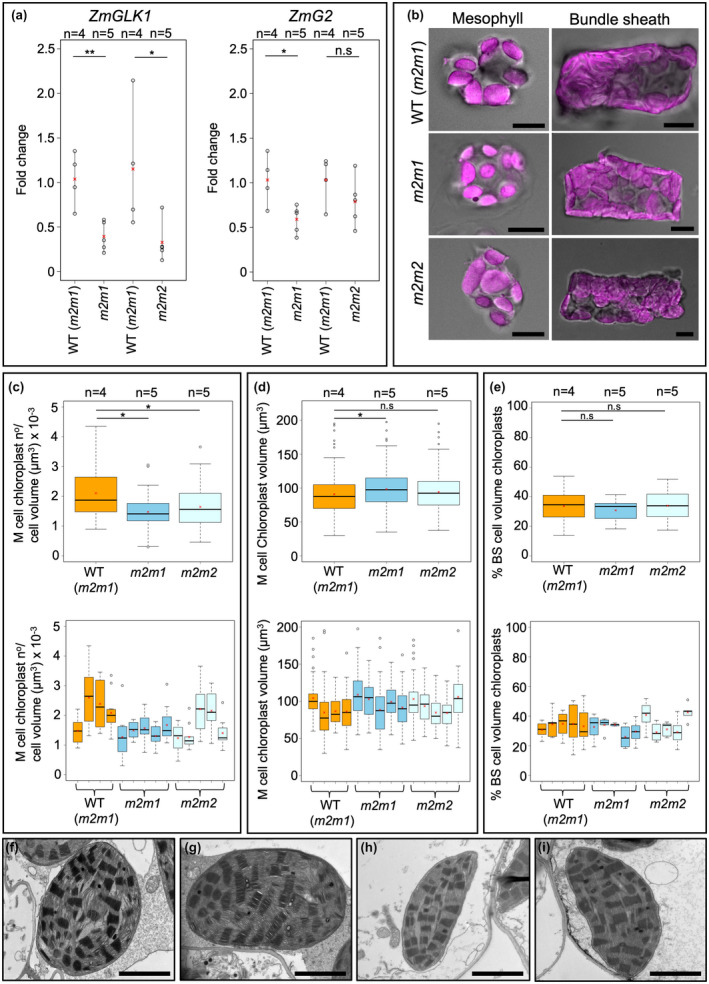
FIGURE 2.

Chloroplast development is not perturbed in Zmscr1;Zmscr1h mutants. (a) Relative transcript levels expressed as fold change of ZmGLK1 (left) and ZmG2 (right) transcripts in both m2m1 and m2m2 double mutants. Biological replicates (n=) are shown above each genotype. Means are shown by a red cross, individual plant datapoints are shown by black open circles. Black lines connect the lowest and highest value in each genotype. Statistical significance between WT (m2m1) and mutants was assessed using a one‐way ANOVA: *p < .05; **p < .01; n.s.p ≥ .05. (b) Isolated mesophyll and bundle‐sheath cells from each genotype. Chloroplast autofluorescence is pink. Scalebars are 10 μm. (c) Chloroplast number normalized by estimated cell volume in M cells. (d) M chloroplast volume. (e) % BS cell volume occupied by chloroplasts. In (c‐e), top plots are pooled results from all biological replicates, bottom plots are data from each plant assessed. Means are shown by a red cross, median by a horizontal black line. Statistical significance was assessed using a one‐way ANOVA and TukeyHSD: *p < .05; n.s.p ≥ .05. (f‐i) TEM images of M cell chloroplasts for both WT (m2m1) (f and g) and m2m1 mutants (h and i). Scalebars are 2 μm
