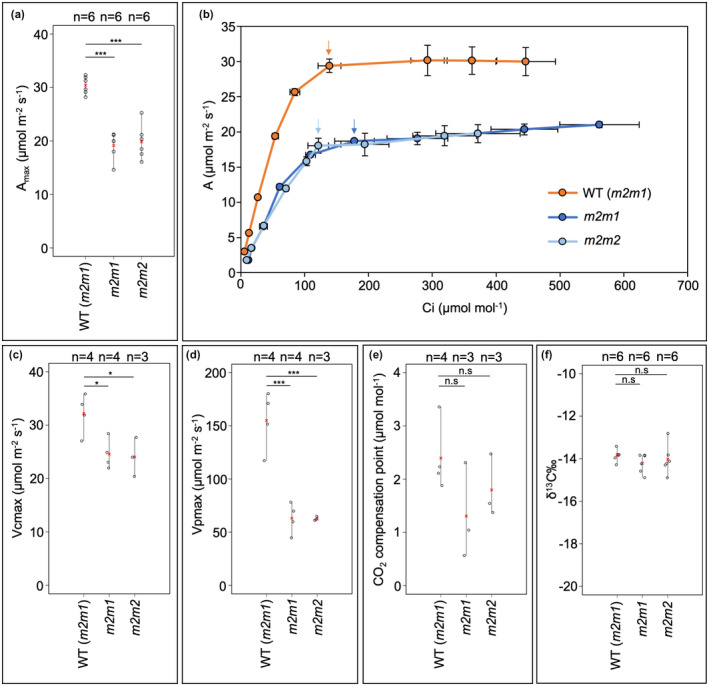
FIGURE 3.

Photosynthesis is perturbed in Zmscr1;Zmscr1h mutants. (a) Amax recorded at 800 μmol/mol CO2. (b) A/Ci curves for each genotype. Each data point is the mean of at least three curves from different plants. Arrows within the plot indicate ambient measurements at 400 μmol/mol. Error bars are standard errors of the mean. (c) V cmax. (d) V pmax. (e) CO2 compensation point. (f) δ13C ‰. In (a) and (c–f) biological replicates (n=) are shown above each genotype. Means are shown by a red cross, individual plant datapoints are shown by black open circles. Black lines connect the lowest and highest value in each genotype. Statistical significance between WT (m2m1) and mutants was assessed using a one‐way ANOVA: *p < .05; **p < .01; ***p < .001; n.s. p ≥ .05
