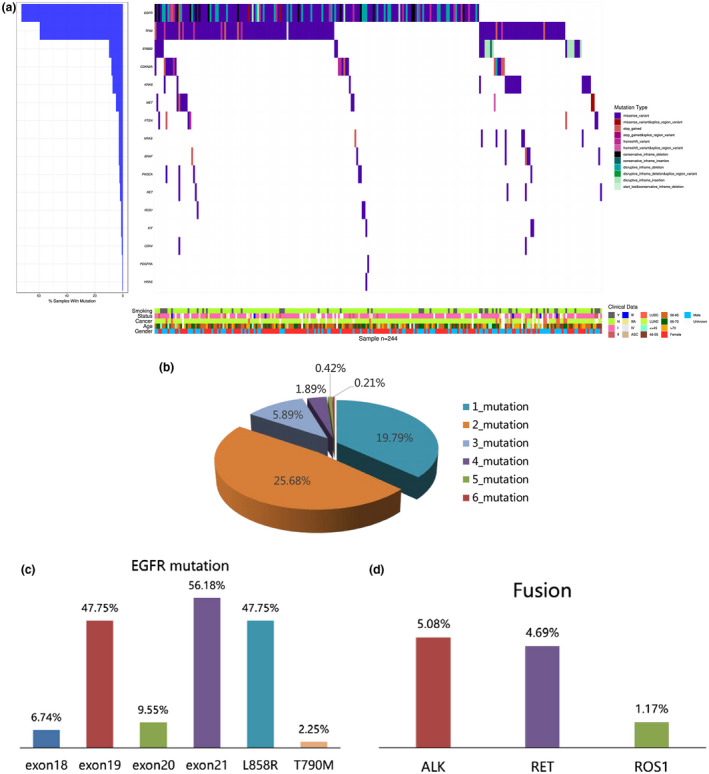
Figure 1.

The genetic profile of nonsmall cell lung cancer (a) For 244 patients (each column), altered genes (rows) with mutations are shown. The percentage of samples with a mutation is noted at the left. The type of genetic mutation is presented in the middle. Clinical information is presented at the bottom. (b) Distribution of altered gene numbers in 256 patients with nonsmall cell lung cancer. (c) Bar chart showing the frequency of EGFR mutation in different subtypes of all NSCLC
