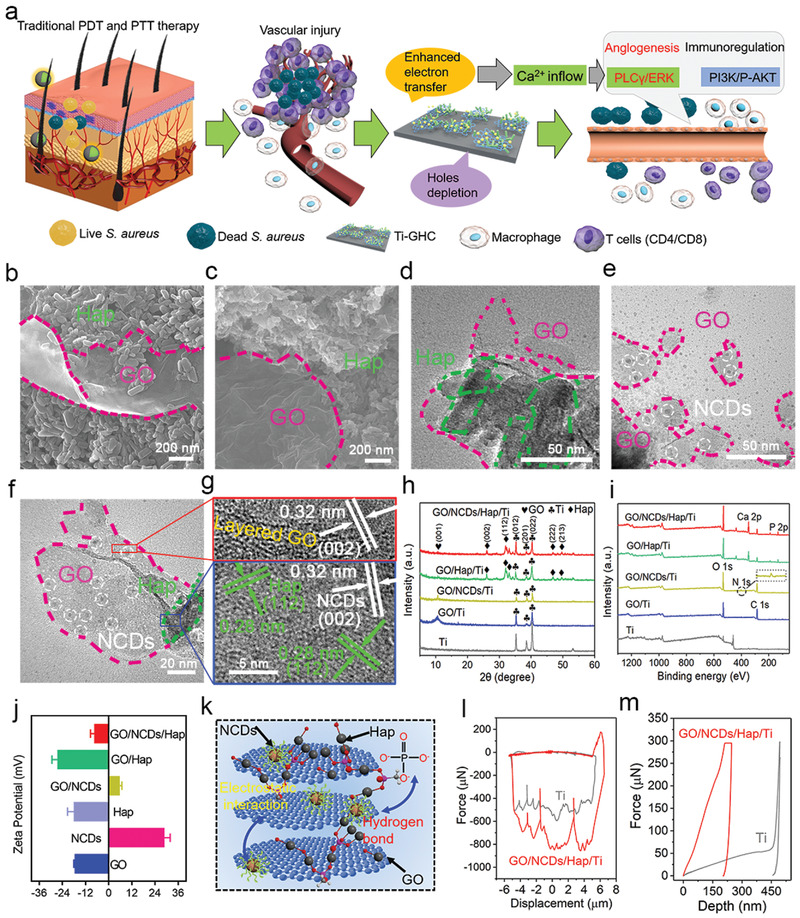
Figure 1.

a,b,c) The SEM images of GO/Hap/Ti and GO/NCDs/Hap/Ti. d–f) The TEM images of GO/NCDs/Ti, GO/Hap/Ti, and GO/NCDs/Hap/Ti, respectively. g) The HRTEM image of GO/NCDs/Hap/Ti. h) The XRD curves of Ti, GO/Ti, GO/NCDs/Ti, GO/Hap/Ti, and GO/NCDs/Hap/Ti, respectively. i) The XPS curves of Ti, GO/Ti, GO/NCDs/Ti, GO/Hap/Ti, and GO/NCDs/Hap/Ti, respectively. j) Zeta potential values of Ti, GO/Ti, GO/NCDs/Ti, GO/Hap/Ti, and GO/NCDs/Hap/Ti, respectively. k) The structure sketch map and binding forces of GO/NCDs/Hap/Ti. l,m) The nanoscratch test and nanoindentation test of Ti and GO/NCDs/Hap/Ti.
