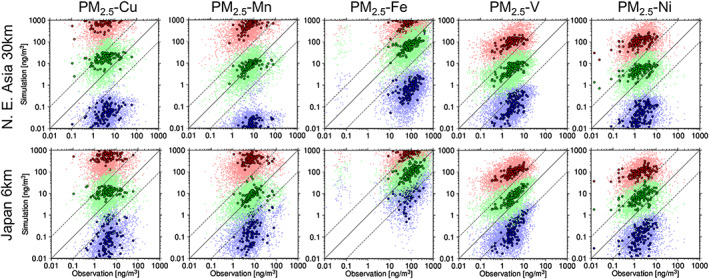
Figure 2.

Scatter diagrams between the simulated (top: D01 with the REASv2 base inventory; bottom: D02 with PM2.5EI/EAGrid/TMG survey base inventory) and the observed daily (small dots with light colors) and annual mean (larger dots with thick colors; 8 weeks of mean of daily values, 2 weeks in each season) (left to right) Cu, Mn, Fe, V, and Ni of PM2.5 at the MOEJ monitoring stations in Japan. The red, green, and blue dots indicate the simulations with the maximum, average, and minimum estimates, respectively. The solid line indicates the 1:1 line, and the two dashed lines indicate the boundaries of the factor of 10.
